ZOOM Short to 230I wish I had posted this play sooner but I have been scalping ZM puts ever since it reject the .618 fib resistance multiple times...
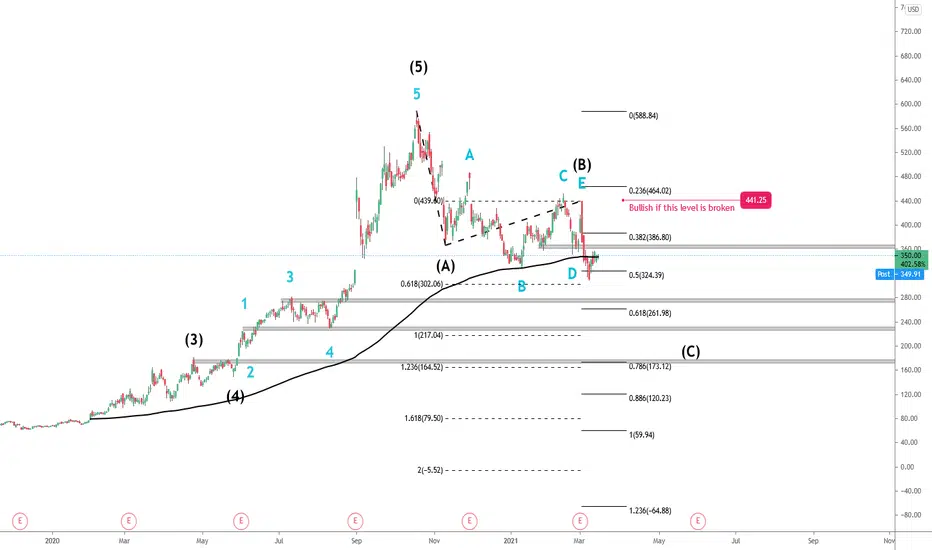
Just by looking at the chart, it seems as though ZM is respecting the fib lines almost to a tee, as you may already know, I only play the .618 and the .382 fibs since those are the most important retracements. ZM has triple tested the .236 fib which is looking fairly weak especially after todays selling volume. I will be adding onto my current position if we get a confirmed break of 315 support. Stop loss will be 325.
This can certainly be a 100%+ play if you consider grabbing some puts a couple weeks out, the market has been dumping the whole week and it doesn't seem like its gonna stop anytime soon.
My positions: 4/16 275p, 5/21 240p
PT1: 292.77
PT2: 273.49
PT3: 232.11
5ZM trade ideas

ZM long 370+Here I listed 1d supply and demands, look how perfectly it bounced right off demand! (green zone) (...pretty much means support)
Im waiting for a clean break of 340 here to swing up to 355 then once it clears the first daily supply we are full throttle to 370 baby!
PT1: 355.82
PT2: 373.66
PT3: 382.39 +


Downtrend pop outWk and Daily have huge divergence forming. Money flow increasing- Rsi divergence
ZM just locked in an exclusive deal with Formula One plus others expected to embed Zm into their apps.
Jumped into 325 calls on Friday-High target 430

Bearish Triangle and Death Cross in Zoom VideoAs Zoom Video Communications continues to struggle, more bearish patterns have appeared on the chart.
First, the recent price action has resulted in a descending triangle, with support around $309. This is a classic continuation pattern, pointing to potentially more downside in coming weeks.
Second, the 50-day simple moving average (SMA) is about to cross below the 200-day SMA. In other words, a “death cross.”
Third, notice how volume has been lower on the green days. Also notice the large bearish engulfing candle on March 2. That’s especially noteworthy because it followed a strong earnings report. It was the second straight quarter that good news was met with selling – another potentially bearish sign.
Finally, other important numbers remain a problem for ZM. Its price/earnings ratio is a whopping 75x and price/sales is 34x. Meanwhile, Treasury yields keep rising and coronavirus infections have fallen. In other words, ZM was a very effective way to play the pandemic. But as that moment seems to fade, it’s a very expensive stock suited to a very different market.
TradeStation is a pioneer in the trading industry, providing access to stocks, options, futures and cryptocurrencies. See our Overview for more.

ZM big close on FridayWatching ZM closely for continuation. Had a great close on Friday so hopefully it can continue into the week.

Growth is definitely not over, just beginningThe market's pricing in lower revenue for Zoom, and other Covid stocks under the (irrational) notion that people will no longer need Zoom after re-opening... however a transformational shift to online working communication, telecommuting, and online education has just taken place and will continue to be the new norm. People are very hesitant to change, period. Now that such a drastic change has occurred in society via online video collaboration and conferencing, people will naturally be hesitant to change especially businesses who benefit from reduced overhead costs and realized they can do just fine without the office real estate. Think of how much communication practice has been supplanted by Facebook and Tinder. New norms and life-changing technology will always be grim and miserable, because money (and war) is the only thing advancing in the world and not human nature and benevolence. Just go long and make money.

Short ZMZoom is hanging by a thread, facing three obsticles:
#1 - Vaccine roll-out is accelerating meaning the days of exclusivity of meetings done virtual are numbered
#2 - People are sick and tired of virtual calls and want in person interaction
#3 - Money printing, initially means higher asset prices, but the delayed impact means interest rate pressure which weights on interest rate sensitive sectors (i.e. technology).
Target $200


ZM Will be available under $300ZM clearly changed how we communicate during COVID. Just the way people mentions GOOGL for searching Zoom has become synonymous for video conferencing in professional. It clearly had its run way ahead of its time pulling forward much of that growth in its stock price. This would be the time to stop the sprint and take a pause for consolidation. So far major gaps have been filled. Now $300 would be a major touchdown target and enter consolidation phase to 290-275 range. Bottom picking can be done when 250 floor has been tested and the growth in earnings continues.


ZOOM future LONGZoom showing us very nice potential for going higher. We are just comming to my HTF demand zone, wait for BFI (banks, funds, institutions) to get into market.
Get in with them.

ZM looks like it could runLooks interesting enough to set some alerts on it. Hopefully that inverse H & S can hit and we can get a good pop.

Parabolic ArcParabolic arcs are long term patterns.
When they correct, they fall 50 to 62% as an average, but 79% or more is very possible. They are often volatile for a while when they find the landing pad.
Parabolic arcs are caused by irrational exuberance.
No recommendation.

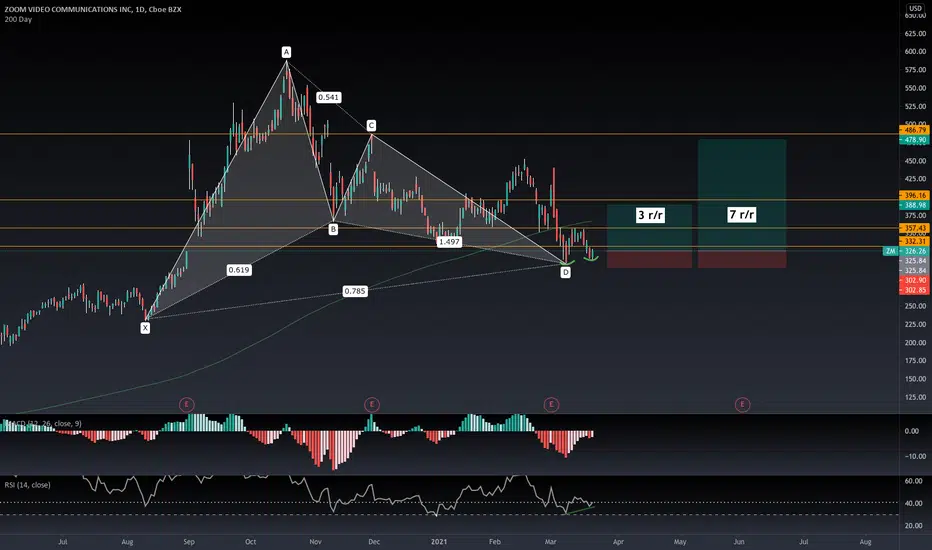
ZMLOND-TERM: Bullish gartley harmonic pattern with a double bottom at the PCZ and bullish convergence on the MACD. (not financial advice)

$ZMIf the price comes down to the (POI) then i think that would be a fair price to buy in and ride it to 1st TP. If it breaks below the (POI) then i would reverse the trade and look for the right oppourtunity to short. Simple as that.
Trade Safe.


ZM is about to double bottomZM is about to test a strong support at 310$ that as been touch recently 08/03/2021, it may create a double bottom
The stock price is currently filling a gap create 01/09/2020 as it suppose to
ZM is in a downtrend and he need to (IT Will!) touche the down green trend line started from is 588$ ATH 19/10/2020
I think ZM need a catalyst to run back up
It is a the bottom Bollinger Band, the RSI is a around 35 if the RSI down to 30 i its a very strong BUY BUY BUY
The potential Upside is huge
The worst case scenario is that it break the 310$ fall to 230
THANKS FOR YOUR SUPPORT, I DO HAVE MORE HOT STOCK TECHNICAL TO SHARE
CLICK THE LIKE BUTTON AND LEAVE A COMMENT

Zoom on Watch Nothing to play but looking for a little consolidation closer to earnings or any breakouts before I look into plays.

Day Trade 1-5 ZoomHere were my notes "RSI looked good, below 100 and 200 EMA, hitting a support, waited for some reversal, still looked a bit questionable and missed a couple times on stop limit buy i believe due to volatility and it triggering above stop buy even though i put in for order when it was below it spiked up, did good to wait it out"

Market Watch Update - Review of list and ZM Short Set-upUpdating the market watch video watchlist from this month.
Hit a lot of our goals and entries quickly this month, so I will post an additional video including new additions to the watch list.

$ZM - Still pointing downIt´s a tricky corrective movement, but this is our primary count at this moment.