SPOT Future 2/19 Price target of 330-350. Bounced off support of 310 nicely on Friday and continued today. Looking for another strong day tomorrow as RSI inches towards the middle-over bought zone.
639 trade ideas


SPOTIFY TECHNOLOGY: How to use wave analysis to forecastHello community we are about to see at least 20% increase in this stock. It may even go more, because the abc corrective structure is complete, so i expect a bull run or an abcde corrective structure in which all structures are bullish. As the pattern develops i will keep this idea updated, so like, comment, follow so you don't miss any update. Thank you.

SPOT looking weakSPOT looking weak here, it's been falling since the earning miss. I want to see it break 305 for a test of ~295 and to potentially get to the 100 day.
💡$SPOT 🎧ARK now owns over $1,000,000,000 in shares!💰+23%🏌️♂️📖 Spotify reported fourth quarter 2020 earnings on Feb, however missed analysts' earnings expectations, sending the stock down 8%. Revenue jumped 17% versus a year ago to $2.58 billion, and net loss was $125 million, or $0.79 per share on an adjusted basis. Analysts were expecting revenue of $2.61 billion and a loss of $0.69 per share. Despite this, Spotify's monthly active users (MAUs) rose 27% year over year to 345 million during the fourth quarter, hitting the top end of its prior guidance for 340-345 million MAUs. Its total number of premium subscribers increased 24% year over year to 155 million, which beat its own forecast for 150-154 million subscribers. Its number of ad-supported MAUs grew 30% to 199 million. Ad revenue rose 29% year over year to 281 million euros ($338 million). Spotify posted a gross margin of 26.5% in the fourth quarter -- up from 24.8% in the third quarter and 25.6% in the prior year quarter -- which surpassed its previous guidance of 24.2%-26.2%. Spotify is clearly growing, just not at the pace that analyst expected
What was interesting from the earning report is that 26% of MAUs engaged with podcast content on Spotify, which is up from 23% in the previous quarter. This is pretty impressive given that podcasts were only introduced on Spotify in 2015. Spotify has recently ramped up its focus on Spotify, signing Joe Rogan, Kim Kardishian and Michelle Obama in deals that have cost hundreds of millions of dollars. The podcasting industry will enjoy an estimated compound annual growth rate of 27.5% through 2027, accompanying 17.8% growth for music streaming, according to Grand View Research. Research by MIDiA suggests Spotify now has majority market share in the podcasts industry accounting for 42% of podcast listeners versus 35% with Apple Music.
Its worth noting that since the disappointing earring call, Ark Invest has added over 584,000 shares to its ARKK and ARKW ETFs. This was $209,000,000 of shares added. Ark now owns over $1 billion of Spotify stock. Ark is clearly bullish on Spotify.
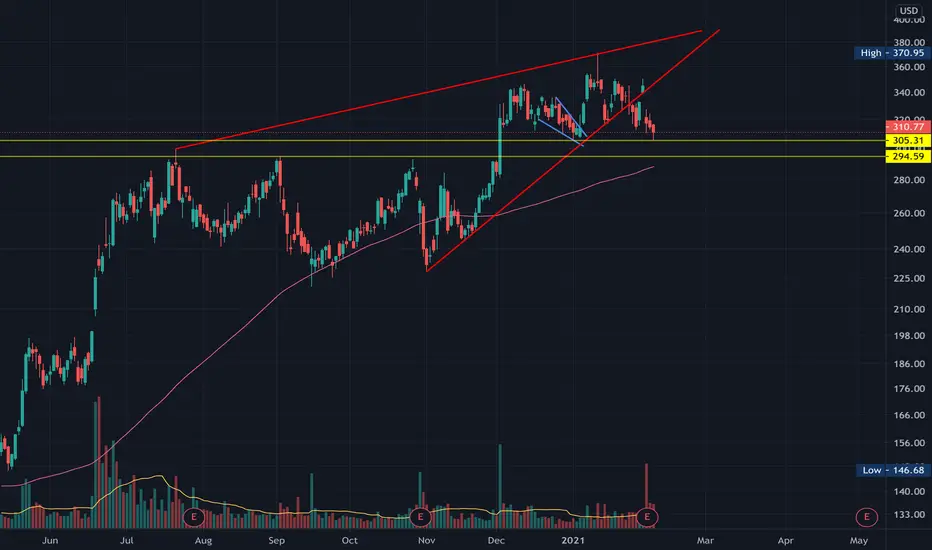
📈Spotify is currently 16% down from its intra-day high of $370. Interestingly, Spotify's price has been range bound for much of the past 8 months. The gap down has created a double bottom in the most recent price range and price has found support previously at $306 to $308 where price is now. Traders should be careful as there is further support at $292 which price may be attracted too. Price is currently also being supported by a bullish channel which price recently bounced off. It is worth that trend lines and price channels are subjective. Price has recently retraced to the 0.5 Fibonacci level. There is also some hidden bullish RSI divergence - RSI is making lower lows but the price is flat. Should price move higher it may reach the -0.13 price extension, which could see 24% upside.
🔎This is not financial advice. Always do your own research and due diligence. Always wait for directional confirmation before entering a trade.

SPOT 2/5Looking for SPOT to finish a micro wave 4 at 300, if it bounces here looking to get in on a wave 2 pullback. Price targets shown on chart.


$SPOT - Great technical trade! No defined r/r yet Below $307.77 I would short. Above $350.57 I would long.

I got an entry at 322 today hereI can see macd divergence close to resistance point, also we're coming to earnings date.


Spotify Long Bids - Bids on fibs and S/R FlipWe can see an explosive breakout from the $200 price point, I'm thinking SPOT cools down in the short term and falls right into my bids on these fib levels.


$SPOT - SPOTIFY TECHNOLOGY 2HR - Finished a wave 4 and broke above the downtrend line on another leg up into W5 TZ.
- Nice move up hitting the 1.75% extension at the 1.272% and pausing.
- Having an inside day today, potentially get a flag to move higher into the 1.618 to 2.272% area for end of Wave 3.
- However Wave 3 like to terminate at 1.75%. But only price action will tell us.

Bullish flag: Example with SpotifyOne of the most commong chart patterns is the flag and it can be a bullish or a bearish depending on the direction it is formed. Usually they are trend - confirming patterns and are occuring after a strong impulse of buying or selling activity, some brief consolidation, and then the price continues in the same direction as the first impulse. The target of the pattern is the "handle" of the flag, meassured from the moment of breach. Sometimes the buying can continue agressively and the price may reach higher than the initial target zone. Traders though interpret differently the target level in regards to the meassurement of the handle. The stop loss is usually placed below the configuration itself, not the handle. That of course can be adjussted by everyone's personal view and risk management. The decision to enter may vary. The first entry can be aggressive with a sell or buy limit near the pattern. Order can be executed after the breach and on the next open, or you can wait out for a correction back to the figure. We say that the flag is complete and confirmed when the initial target level is reached.
In the example we see current development of a bullish flag in Spotify. The breach here was minimal and not that convicning, but the next open was strong and with a gap. Yesterday's close is a classic correction of the initial impulse of 40% to 50% of the candle.

$SPOT Long into 400Holding prior resistance today at the close, inside day, should give us an idea tomorrow on whether the breakout was real. NYSE:SPOT


Spotify Fib Price TargetUsing the Fib Retracement tool here is my swing trade price target for Spotify. It has broken out of a parallel channel strongly. Trail up your stop losses on this one using a lower time frame such as the 30 minute or 1 hour.

Spotify Fib Price TargetUsing the Fib Retracement tool, as learned from the Fibonacci Queen on Youtube, here is my swing trade price target for Spotify.

SPOT - EW analysis - up trend SPOT - It is in strong up trend with ABC zigzag move initially (or it may be huge impulse up). It is in 5th wave of intermediate cycle and expected to make new high. Buy the small pull back with stop level below 306.75 for target above 350.
Give thumbs up if you really like the trade idea.

Update on Spotify: bullish flag triggered Buyers were able to pinch trough the flag's resistance level and thus trigger the formation.
Two scenarios in this case may follow:
1. Price tests again the figure and continues it's way up;
2. Price aggressively starts to rise and complete the flag fast with big volumes;

