SPOT 1D BITCOIN INDICATOR LONG TRADEBITCOIN INDICATOR WORKS ON ALL MARKETS & TIME FRAMES.
Bitcoin Indicator shows the Entry Signal level.
Bitcoin Indicator shows the Stop Loss level.
Bitcoin Indicator shows the Take Profit level.
639 trade ideas

SPOT options trade idea 💡 Once it break $254
Swing option $300 calls for 20th nov
Lotto option $300 calls for 30th oct
Safe and long term option $280 calls for 15th Jan 2021
*please do some research before entering*
Trade safe 🙏


SPOTBased on my analysis:
1. SPOT formed double bottom (01 October).
2. My 1st target 265 USD & 2nd 267.50 USD /

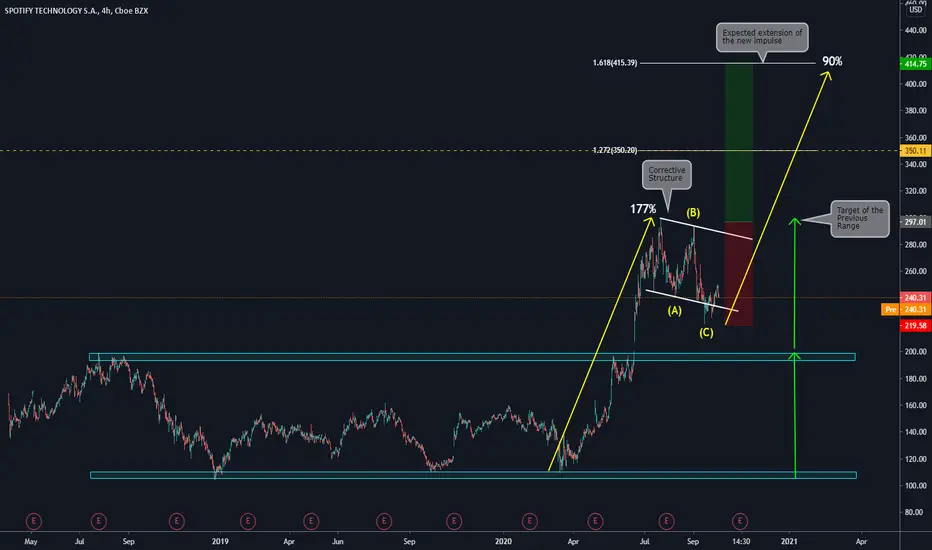
Our Stock of the Day / SPOTToday we have a Swing trade to share; consider that this type of setups can take months until an exact resolution. Here we will give you a full explanation.
Main items we can see on the chart:
a) The price was inside a Huge range that has been broken; a good way to understand the target of the broken range is to extend the size of it towards the broken side
b) We can see that the price reached that extension, and after that, a corrective structure was formed
c) The current corrective structure is an ABC pattern with great proportions with the previous impulse. Based on that, we consider that the structure is completed
d) Now we want to trade the breakout of the ABC or ZIG-ZAG pattern
e) We have our Entry orders above B and our Stop below C. We are using Fibo Extensions to define our Take Profit (1.618 level ) and Break-Even (1.272 level)
f) IF the setup is executed, we expect a resolution between 100 and 150 days
g) We will take the risk of 1% of our Capital on this setup
h) We will cancel the setup IF the price makes a new low below C
i) Remember: Trade Safe, protect your Capital, and always understand what you are doing!

Spotify for long This stock I've been watching to get on a long position and I might just jump in today.

$SPOT New Lazy Elliott Fibonacci PlotIt has been months since I last plotted this and it exceeded expectations.
Initial assumption on the left retracement is that the subwave impulse is complete and is doing a long correction.
Good base so far.
Take note of the following:
>It can rally until the 100% of the right retracement if the overall market sentiment is positive.
>Otherwise, expect the stock to do another leg down at least near the 38.2% level.
>Probably an ongoing major Wave 2.
Good luck!

At key support, could fall on market weaknessWith more selling likely ahead I'll be looking to SPOT as a short. Its currently sitting at a key fib and today's push was unsustained as shown. In a previous session price dipped down quickly to tap the lower fib, I'd anticipate similar action if it falls alongside the market.


Massive Bullrun Into Earnings | Moving In Divergence $SPOTIt's time to unload on longterm shares. No one is paying attention to Spotify SPOT . Media outlets and even us traders have both been rather silent on Spotify and it's movement.
~
This stock currently sits above what has proven to be a temp support @ $230 . We have a monthly support @ $227
Watching the orange downtrend as previous resistance, we just saw a confirmation of this breakout today.
Possible long on a break of downtrend with next resistance @ $242.
Upside targets: $242, $265, $284.
Possible Short Entry: $220
DotcomJack | Thanks for the support!
Bless up traders

SPOT has been on a tear in 2020.. but will it continue?Diving into SPOT, if you've been in this stock this year you've probably been pretty happy with the performance. With a number of big product releases and the effects of JOE ROGAN and MICHELLE OBAMA signing exclusive deals to drive subscribers, the stock pumped so fast from around $180 to nearly $300, that if you blinked you probably missed it.
Well, what now? Do you buy at these levels, do you wait? Whats this company really worth?
Obviously SPOT has a lot of competition. With AAPL launching their new subscription service packages that basically will force me to have Apple Music, and AMZN launching podcasting on their music service, how many music services does one person need?
I still love my SPOT subscription more than any other service option out there. That's what keeps me believing in this stock. I don't want to ever give up my Spotify, and I bet most others don't either. I'm willing to put my money where my mouth is.
Remember NFLX just 5 years ago? That might be where SPOT is today. It's worth considering.
Now let's look at the chart. I've drawn an Elliot Wave pattern in there, and what a correction might look like. We are definitely in a correction pattern right now. My intuition and my bet is that we are in the 2nd wave of a much larger cycle. What excites me about that is the 3rd wave tends to be the largest move. That would mean if you want to play a longer term trade like me, you want to buy in anywhere in the $182-$227 range. I would recommend your sweet spot to be above $200, even around $210-220 depending on your tolerance for missing a buy opportunity.
This stock has a lot of love, and psychological supports are a thing. That's why I find it unlikely we'll see this stock below $200 again unfortunately, and if we do then we need to double check our fundamental analysis and if nothing has changed we will go in with both hands.
Now the real exciting part of that trade, should you get in around these levels and lower, is the longer term target is close to $400. Should SPOT continue to diversify their service offering and have that "sticky" product effect where it's just something we all need to have, this isn't farfetched, and is a likely story to happen in the next 1 year.
Meanwhile, for the shorter term trades, volatility in this stock can be good, and therefore if we are in a 2nd wave correction, then this is a great time to both be getting a position, but also trading within the correction to make that position as cheap as possible for your 3rd wave run.
If this does manifest, and one plays it correctly, by the time you reach my longer term target you should be able to sell a portion of your stack and hold a free and sizable position in this household name.
Disclaimer: I am not a professional, nor do I claim to know what I am doing. I chart for my own education and revealing potential trade setups. I am always open to constructive feedback and resources that you can recommend to "up" my game. Thank you!

SPOT Analysis SPOT Long
Ideal Entry Level: 228.27
Price Target: 258.87
Stop Loss: 226.69
Contract: 10/16 270 calls (1.2k volume Today)
Risky Contract: 9/25 240 calls

Spot - Spotting That ReversalSpot recently slid 20% over the last week. Currently, the price is at an opportunistic level for a trade.
Stochastic RSI has bottomed. However, the signal line has not risen above 20, which would indicate strong momentum.
Currently, the momentum on the daily chart is indicated on the price action of the daily candle by the long wick which hit a low of 220.
The RVI has dropped and tells us that most of the volatility (as measured by the indicator) has disappeared.
If this price action continues and a reversal takes place, there is a potential upside of 10-20%.
If the price action is unable to climb back up, we can set a stop loss at it's previous support at $224.


SPOTIFY - Still King Of Music StreamingMissed out on this one earlier this year as would've loved to have gotten in once it broke that $160 level but had funds tied in other positions. Nonetheless, we're always watching and it looks like we may get another chance at a descent move in $SPOT. Remember, Spotify is like thr Netflix of streaming music. There's plenty of streaming music services but Spotify is still king. $SPOT leads the music streaming industry with over 138 million paying subscribers and 170 million people using its free advertising-supported service feature in over 90 countries. That is a colossal amount of reach. For comparison, Apple Music is estimated to have around 82 million subscribers.
The amount of active listeners dropped over the summer due to Covid19 related factors. Gyms closed, people working from home and didn't listen in their cars, less traffic so less listening time, etc. Musicians have even delayed albums since they can't perform at concerts just yet. Stock has still shot up since March like the rest of tech, and we could be seeing a drop soon if it follows the sector.
TA:
We would love an entry around the $175-$195 region if it gets to there. Looking to see if support would hold around the $225 Fib Retracement line or not. We're also eyeing the 200 day MA in white for possible support as well. Since we love Spotify even as a long term hold, we're not going to try and predict a bottom but looking for support at the levels and dollar cost average our way in.
Disclaimer:
I do not provide personal investment advice and I am not a qualified licensed investment advisor. I am an amateur investor.
All information found here, including any ideas, opinions, views, predictions, forecasts, commentaries, suggestions, or stock picks, expressed or implied herein, are for informational, entertainment or educational purposes only and should not be construed as personal investment advice. While the information provided is believed to be accurate, it may include errors or inaccuracies. I will not and cannot be held liable for any actions you take as a result of anything you read here.
Conduct your own due diligence, or consult a licensed financial advisor or broker before making any and all investment decisions. Any investments, trades, speculations, or decisions made on the basis of any information found on here, expressed or implied herein, are committed at your own risk, financial or otherwise.
Feel free to give us a follow and shoot us a like for more analysis updates.


SPOT - 4.05% Profit Potential - Support Corridor BreakoutThis week we need to play conservative and take home whatever we can. Targets are moderate and realistic, and I aim to close positions fast, often before the end of the day.
Allocate less than usual capital if you would like an extra layer of safety. The market is uncertain and we want to keep our risk to the minimum.
- Breakout past a 3-month correction
- RSI + Stoch below 50
- MACD below Signal
Suggested Entry $237.80
Suggested Stop Loss $240.64
Target price $228.19
About me
- August P/L: +203.83% | Wins 85.19% | No Trades without Analysis
- Note that I tend to adjust stop losses in order to secure profits early and preserve capital. This means that the target price is going to be achieved as long as there are no strong pullbacks that trigger my new adjusted stop loss.

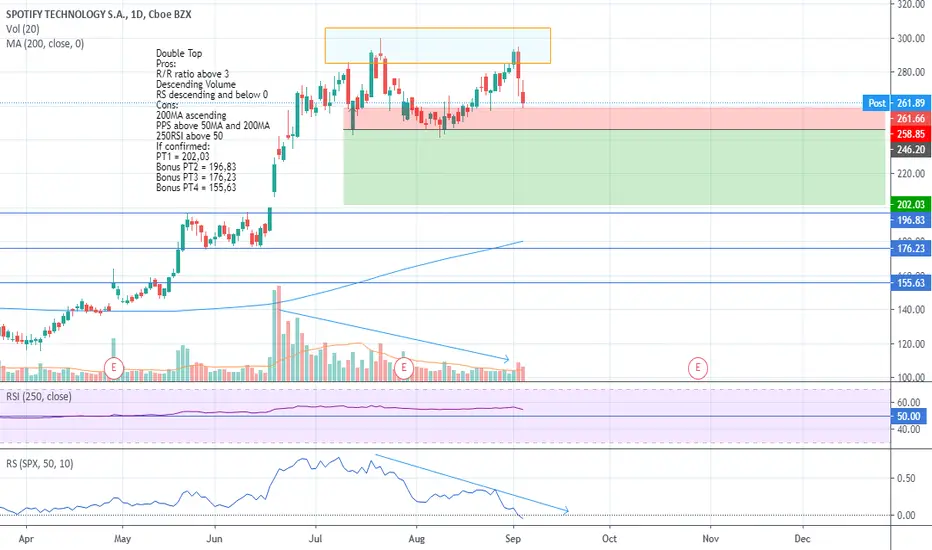
SPOT: Double TopDouble Top
Pros:
R/R ratio above 3
Descending Volume
RS descending and below 0
Cons:
200MA ascending
PPS above 50MA and 200MA
250RSI above 50
If confirmed:
PT1 = 202,03
Bonus PT2 = 196,83
Bonus PT3 = 176,23
Bonus PT4 = 155,63
Cup and Handle breakout, alternate fib levelsSame bullish thesis with different fib levels drawn from different highs and lows, we will see which prove to be more accurate.

Cup and handle breakout above 280.66After breaking out on Friday but failing to hold and closing just below, it looks set up to continue next week with good market conditions.
