GOOG | Long | Breakout After Ranging Base | (Aug 2025)GOOG | Long | Breakout After Ranging Base | (Aug 2025)
1️⃣ Short Insight Summary:
GOOG has been ranging for nearly a year between ~$125–$185, forming a strong accumulation base. If it successfully retests the $181–182 zone, I’m looking for a breakout entry with a long-term upside.
2️⃣ Trade Parame
Key facts today
Next report date
—
Report period
—
EPS estimate
—
Revenue estimate
—
7.514 CHF
90.93 B CHF
317.69 B CHF
5.04 B
About Alphabet Inc (Google) Class C
Sector
Industry
CEO
Sundar Pichai
Website
Headquarters
Mountain View
Founded
2015
FIGI
BBG00LVD61W6
Alphabet, Inc. is a holding company, which engages in software, health care, transportation, and other technologies. It operates through the following segments: Google Services, Google Cloud, and Other Bets. The Google Services segment includes products and services, such as ads, Android, Chrome, devices, Google Maps, Google Play, Search, and YouTube. The Google Cloud segment refers to infrastructure and platform services, collaboration tools, and other services for enterprise customers. The Other Bets segment relates to the sale of healthcare-related services and internet services. The company was founded by Lawrence E. Page and Sergey Mikhaylovich Brin on October 2, 2015 and is headquartered in Mountain View, CA.
Related stocks

Big Money is Buying GOOGL Calls — Are You In?
## 🚨 GOOGL WEEKLY TRADE IDEA (Aug 4–8)
**Institutional CALL Buying Surges — \$197.50 CALL Setup Triggered**
---
### 📊 Model Consensus Breakdown:
* **🔁 Call/Put Ratio**: **3.33** — strong bullish options bias
* **📉 RSI**: Weak Daily & Weekly = ⚠️ caution zone
* **💰 Volume**: Institutional call f

GooglSimple chart here ... I think Googl heads to 210 by sept then corrects
Daily chart
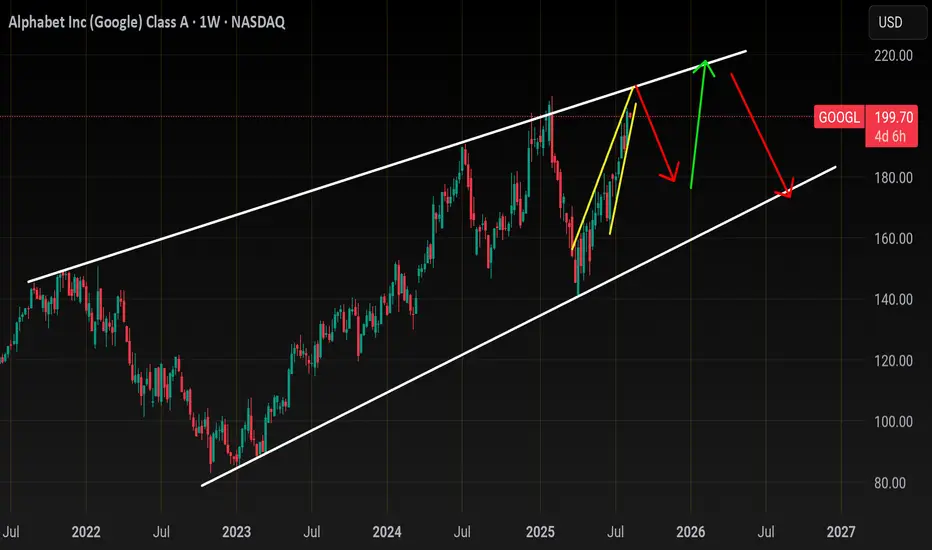
Looks like a rising wedge which I think will fulfill a correction from 210 to 180 between Sept and mid Oct..
I don't think googl will break back below 192 before 210 and I don't think googl breaks over 210
I am bullish on GOOGLE stockI am bullish on GOOGLE stock
Following last week's pullback, I see a positive ride back to the all-time high (ATH) around $209 or beyond.
Trade with care.
I look forward to connecting with you.
Please share your thoughts in the comment section, share, like and follow

GOOG 2026 LEAPs: $205 Calls for the Next Big Tech Wave!## 🚀 GOOG LEAP Setup (2025-08-08) 🚀
**Bias:** 📈 **Moderate Bullish** (short-term momentum + low volatility)
**Strategy:** Buy Call LEAP – Target upside with managed risk.
**🎯 Trade Plan**
* **Instrument:** \ NASDAQ:GOOG
* **Type:** CALL (LONG)
* **Strike:** \$205 (0.6-0.7 delta sweet spot)
* **E

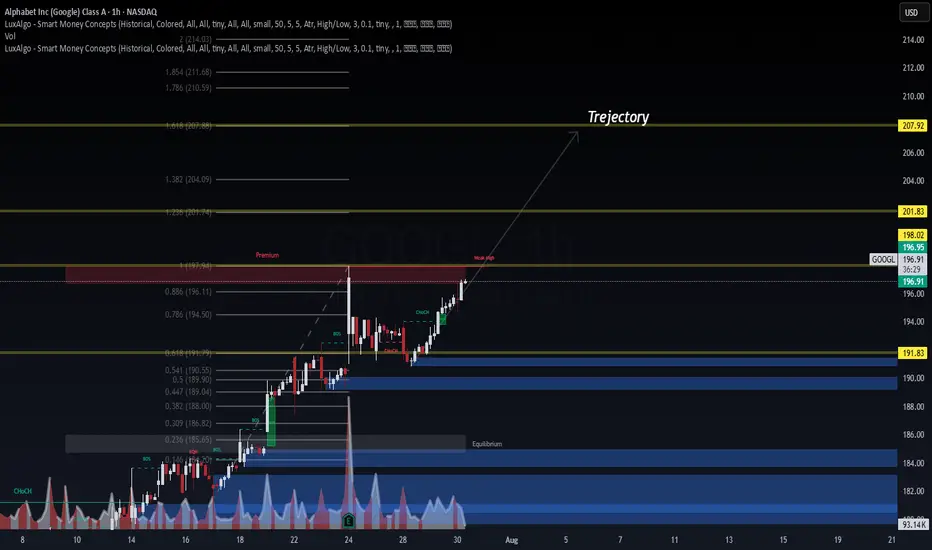
GOOGL Holding the Uptrend – Is $200 Within Reach? Aug 7📊 Technical Analysis (1H & 15M Chart)
GOOGL continues to respect the ascending trendline formed from the August 1st low, bouncing cleanly from higher lows and holding above 194–195 support. On the 1H chart, MACD remains slightly bullish with histogram building positive momentum, and Stoch RSI is try

GOOGL Poised for a Breakout! Aug. 5GOOGL Poised for a Breakout! Key Gamma Levels Driving the Next Move 🚀
Technical Analysis & GEX Insights
GOOGL has been grinding higher after finding support around the 185–186 zone and holding the bullish recovery trend. Price is now consolidating just under 195, setting the stage for a potential b
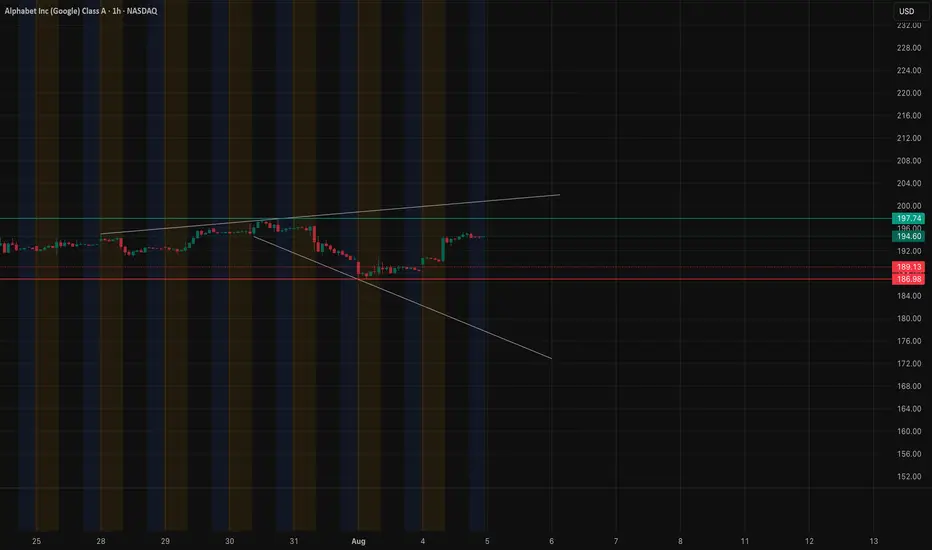
$GOOG Eyes Breakout Above $198Currently at $197.12, NASDAQ:GOOG is trading above both its 50-period SMA (~$196.00) and 200-period SMA (~$192.50) on the 30-minute chart. The trend remains bullish with support holding firm at $192.50, and bulls are watching closely as the price flirts with resistance near $198.75. This steady gr

GOOGL Forecast – Dual AI Model Confirmation📊 GOOGL Forecast – Dual AI Model Confirmation
🔹 Posted by WaverVanir | VolanX Protocol
NASDAQ:GOOGL is showing strong bullish structure backed by both Smart Money Concepts (SMC) and AI model consensus.
🧠 VolanX AI Protocol Forecast (30-Day)
🎯 Target: $223.08 (+13.3%)
📈 Accuracy: 98.2%
📉 Drawdown
$GOOG: Wired Paths🏛️ Research Notes
Examining interconnection:
Progression started with highs expanding until some point where contraction of both time and price difference of those highs.
Being aware of its geodesics, I choose to map the surface area of that transformation. Hence, I ended up with this stru

See all ideas
Summarizing what the indicators are suggesting.
Neutral
SellBuy
Strong sellStrong buy
Strong sellSellNeutralBuyStrong buy
Neutral
SellBuy
Strong sellStrong buy
Strong sellSellNeutralBuyStrong buy
Neutral
SellBuy
Strong sellStrong buy
Strong sellSellNeutralBuyStrong buy
An aggregate view of professional's ratings.
Neutral
SellBuy
Strong sellStrong buy
Strong sellSellNeutralBuyStrong buy
Neutral
SellBuy
Strong sellStrong buy
Strong sellSellNeutralBuyStrong buy
Neutral
SellBuy
Strong sellStrong buy
Strong sellSellNeutralBuyStrong buy
Displays a symbol's price movements over previous years to identify recurring trends.
US2079KAF4
ALPHABET 20/50Yield to maturity
6.97%
Maturity date
Aug 15, 2050
US2079KAG2
ALPHABET 20/60Yield to maturity
6.85%
Maturity date
Aug 15, 2060
US2079KAE7
ALPHABET 20/40Yield to maturity
6.11%
Maturity date
Aug 15, 2040
GOOG6065579
Alphabet Inc. 5.3% 15-MAY-2065Yield to maturity
5.48%
Maturity date
May 15, 2065
GOOG6065578
Alphabet Inc. 5.25% 15-MAY-2055Yield to maturity
5.32%
Maturity date
May 15, 2055
GOOG6065581
Alphabet Inc. 4.5% 15-MAY-2035Yield to maturity
4.65%
Maturity date
May 15, 2035
US2079KAD9
ALPHABET 20/30Yield to maturity
4.35%
Maturity date
Aug 15, 2030
XS306443038
ALPHABET 25/54Yield to maturity
4.21%
Maturity date
May 6, 2054
US2079KAC1
ALPHABET 16/26Yield to maturity
4.17%
Maturity date
Aug 15, 2026
XS306442783
ALPHABET 25/45Yield to maturity
4.02%
Maturity date
May 6, 2045
GOOG6065580
Alphabet Inc. 4.0% 15-MAY-2030Yield to maturity
3.95%
Maturity date
May 15, 2030
See all ABEC bonds
Curated watchlists where ABEC is featured.


Frequently Asked Questions
The current price of ABEC is 158.982 CHF — it has increased by 1.25% in the past 24 hours. Watch ALPHABET INC stock price performance more closely on the chart.
Depending on the exchange, the stock ticker may vary. For instance, on BX exchange ALPHABET INC stocks are traded under the ticker ABEC.
ABEC stock has fallen by −0.61% compared to the previous week, the month change is a 13.94% rise, over the last year ALPHABET INC has showed a 13.31% increase.
We've gathered analysts' opinions on ALPHABET INC future price: according to them, ABEC price has a max estimate of 201.69 CHF and a min estimate of 145.22 CHF. Watch ABEC chart and read a more detailed ALPHABET INC stock forecast: see what analysts think of ALPHABET INC and suggest that you do with its stocks.
ABEC reached its all-time high on Nov 18, 2021 with the price of 2,775.540 CHF, and its all-time low was 81.493 CHF and was reached on Jan 6, 2023. View more price dynamics on ABEC chart.
See other stocks reaching their highest and lowest prices.
See other stocks reaching their highest and lowest prices.
ABEC stock is 1.23% volatile and has beta coefficient of 0.95. Track ALPHABET INC stock price on the chart and check out the list of the most volatile stocks — is ALPHABET INC there?
Today ALPHABET INC has the market capitalization of 1.97 T, it has decreased by −0.10% over the last week.
Yes, you can track ALPHABET INC financials in yearly and quarterly reports right on TradingView.
ALPHABET INC is going to release the next earnings report on Oct 28, 2025. Keep track of upcoming events with our Earnings Calendar.
ABEC earnings for the last quarter are 1.83 CHF per share, whereas the estimation was 1.73 CHF resulting in a 5.82% surprise. The estimated earnings for the next quarter are 1.89 CHF per share. See more details about ALPHABET INC earnings.
ALPHABET INC revenue for the last quarter amounts to 76.51 B CHF, despite the estimated figure of 74.61 B CHF. In the next quarter, revenue is expected to reach 80.99 B CHF.
ABEC net income for the last quarter is 22.37 B CHF, while the quarter before that showed 30.58 B CHF of net income which accounts for −26.84% change. Track more ALPHABET INC financial stats to get the full picture.
Yes, ABEC dividends are paid quarterly. The last dividend per share was 0.17 CHF. As of today, Dividend Yield (TTM)% is 0.40%. Tracking ALPHABET INC dividends might help you take more informed decisions.
ALPHABET INC dividend yield was 0.32% in 2024, and payout ratio reached 7.46%. The year before the numbers were 0.00% and 0.00% correspondingly. See high-dividend stocks and find more opportunities for your portfolio.
As of Aug 13, 2025, the company has 183.32 K employees. See our rating of the largest employees — is ALPHABET INC on this list?
EBITDA measures a company's operating performance, its growth signifies an improvement in the efficiency of a company. ALPHABET INC EBITDA is 110.17 B CHF, and current EBITDA margin is 36.45%. See more stats in ALPHABET INC financial statements.
Like other stocks, ABEC shares are traded on stock exchanges, e.g. Nasdaq, Nyse, Euronext, and the easiest way to buy them is through an online stock broker. To do this, you need to open an account and follow a broker's procedures, then start trading. You can trade ALPHABET INC stock right from TradingView charts — choose your broker and connect to your account.
Investing in stocks requires a comprehensive research: you should carefully study all the available data, e.g. company's financials, related news, and its technical analysis. So ALPHABET INC technincal analysis shows the buy rating today, and its 1 week rating is buy. Since market conditions are prone to changes, it's worth looking a bit further into the future — according to the 1 month rating ALPHABET INC stock shows the neutral signal. See more of ALPHABET INC technicals for a more comprehensive analysis.
If you're still not sure, try looking for inspiration in our curated watchlists.
If you're still not sure, try looking for inspiration in our curated watchlists.