GOOG | Long | Breakout After Ranging Base | (Aug 2025)GOOG | Long | Breakout After Ranging Base | (Aug 2025)
1️⃣ Short Insight Summary:
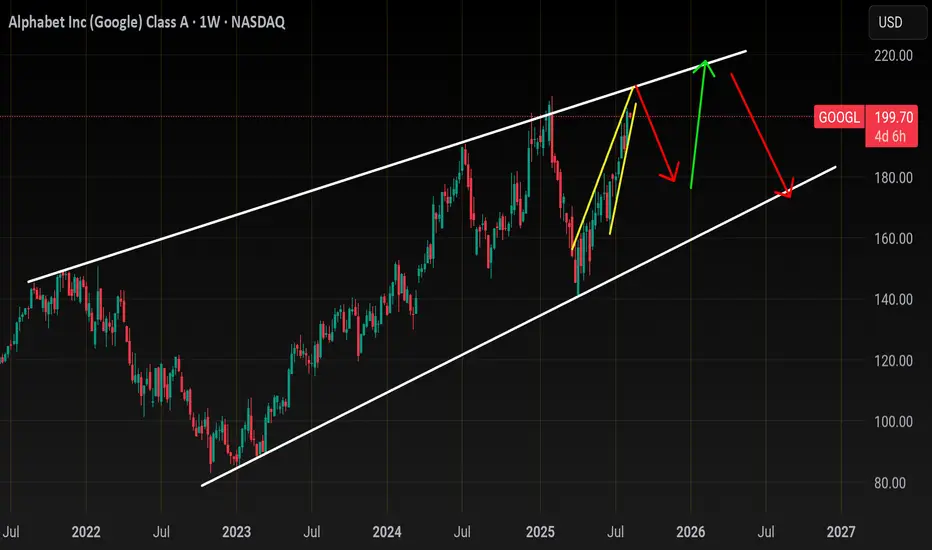
GOOG has been ranging for nearly a year between ~$125–$185, forming a strong accumulation base. If it successfully retests the $181–182 zone, I’m looking for a breakout entry with a long-term upside.
2️⃣ Trade Parameters:
Bias: Long
Entry Zone: $181–182 (after a successful retest and confirmation)
Stop Loss: $174 (tight invalidation below support)
TP1: $204 (first momentum target)
TP2: $245 (mid-term resistance)
Partial Exits: Around $226 and $264 (based on prior structure and historical resistance)
Long-Term Target: $370–420 if the multi-year structure plays out
3️⃣ Key Notes:
✅ GOOG has shown strong financial health (Altman Z-score 12.4, low debt)
✅ It trades at a modest valuation (P/E ~18–19× vs peers at ~44×)
✅ A breakout could be fueled by AI and Cloud growth, especially if regulatory headwinds ease after the August 8, 2025, antitrust resolution
❌ If price breaks above without retesting $181, I’ll skip the trade—no chase
❌ AI disruption and regulatory overhang still loom as longer-term risks
4️⃣ 💡 If this idea reaches 10+ likes 👍, I’ll post a detailed follow-up with updated chart levels and trade management zones!
Please LIKE 👍, FOLLOW ✅, SHARE 🙌 and COMMENT ✍ if you enjoy this idea! Every interaction helps keep the content free, pushes it to more traders, and motivates me to post deeper analysis here on TradingView.
Disclaimer: This is not financial advice. Always conduct your own research. This content may include enhancements made using AI.
ABEC trade ideas

Big Money is Buying GOOGL Calls — Are You In?
## 🚨 GOOGL WEEKLY TRADE IDEA (Aug 4–8)
**Institutional CALL Buying Surges — \$197.50 CALL Setup Triggered**
---
### 📊 Model Consensus Breakdown:
* **🔁 Call/Put Ratio**: **3.33** — strong bullish options bias
* **📉 RSI**: Weak Daily & Weekly = ⚠️ caution zone
* **💰 Volume**: Institutional call flow ✅ but light overall volume ❌
* **🧠 AI Model Split**:
* ✅ **Grok, Gemini**: Bullish lean
* ⚠️ **Claude, DeepSeek**: No trade – weak conviction
* ⚖️ **Meta**: Wait-and-see bias
🧭 **Net Sentiment: MODERATE BULLISH** (With structural caution)
---
### 🎯 Trade Setup:
| 🔧 Strike | 💵 Entry | 🎯 Target | 🛑 Stop | 📅 Expiry | 🔒 Confidence |
| ------------- | -------- | --------- | ------- | --------- | ------------- |
| \$197.50 CALL | \$0.69 | \$1.05+ | \$0.34 | Aug 8 | 65% ✅ |
🕰 **Entry Timing:** Market open
🔍 **Volume Note:** Trade ONLY if opening volume aligns with premarket flow
📉 **Momentum Flag:** Falling RSI = quick exits if invalidated
---
### 🔥 WHY IT MATTERS:
* **Whales Are Loading Calls** despite momentum weakness
* **VIX Low = Options Cheap** = better R\:R on call spreads or singles
* **Target Return**: \~52% upside on premium w/ tight risk guardrails
---
### 🚨 RISKS:
* RSI trend down → invalidates quickly
* Weak market breadth = easy rejection on fakeouts
* Earnings hangover & macro drag = overhang risk
---
### 🏷️ Hashtags / Tags:
`#GOOGL #Alphabet #OptionsTrade #CallOption #AITrading #BullishFlow #TradingView #WeeklySetup #StockSignal #RiskReward`

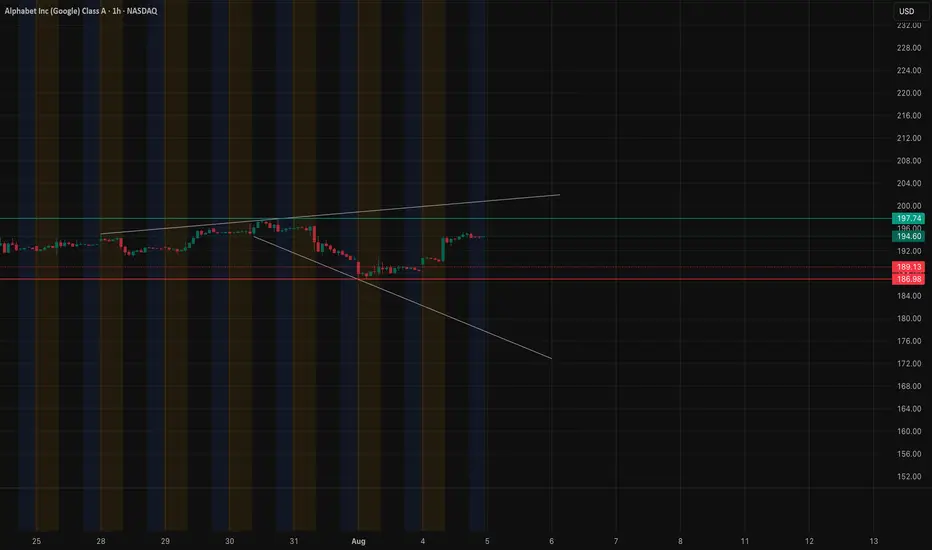
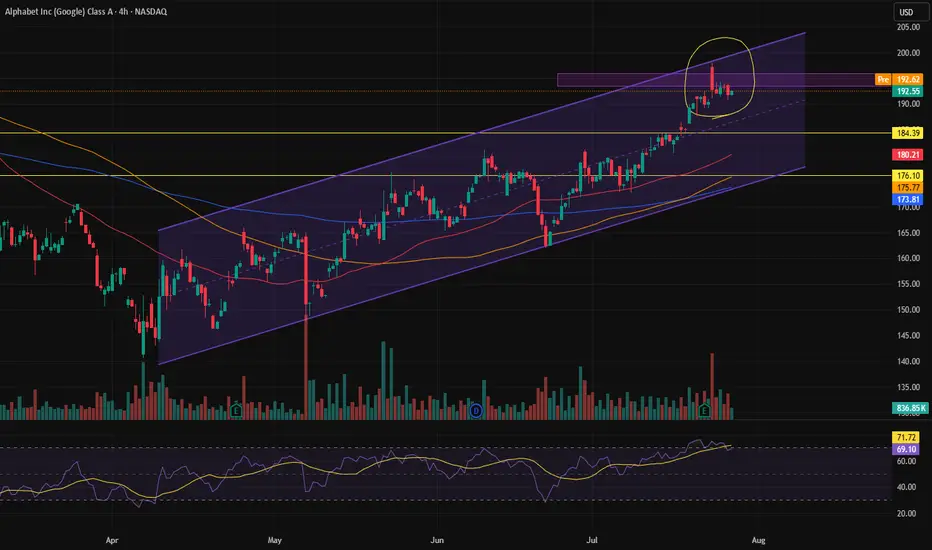
GooglSimple chart here ... I think Googl heads to 210 by sept then corrects
Daily chart
Looks like a rising wedge which I think will fulfill a correction from 210 to 180 between Sept and mid Oct..
I don't think googl will break back below 192 before 210 and I don't think googl breaks over 210
I am bullish on GOOGLE stockI am bullish on GOOGLE stock
Following last week's pullback, I see a positive ride back to the all-time high (ATH) around $209 or beyond.
Trade with care.
I look forward to connecting with you.
Please share your thoughts in the comment section, share, like and follow

GOOG 2026 LEAPs: $205 Calls for the Next Big Tech Wave!## 🚀 GOOG LEAP Setup (2025-08-08) 🚀
**Bias:** 📈 **Moderate Bullish** (short-term momentum + low volatility)
**Strategy:** Buy Call LEAP – Target upside with managed risk.
**🎯 Trade Plan**
* **Instrument:** \ NASDAQ:GOOG
* **Type:** CALL (LONG)
* **Strike:** \$205 (0.6-0.7 delta sweet spot)
* **Entry:** \$27.40
* **Profit Target:** \$54.80 (+100%)
* **Stop Loss:** \$18.22 (-30%)
* **Expiry:** 2026-09-18
* **Size:** 1 contract
* **Confidence:** 72%
**📊 Key Notes:**
* RSI (Weekly): 70.1 → strong momentum
* VIX: 15.4 → favorable for LEAP entries
* High valuation (90% of 52-week range) = pullback risk ⚠️
* OI = 0 → possible liquidity challenges

GOOGL Holding the Uptrend – Is $200 Within Reach? Aug 7📊 Technical Analysis (1H & 15M Chart)
GOOGL continues to respect the ascending trendline formed from the August 1st low, bouncing cleanly from higher lows and holding above 194–195 support. On the 1H chart, MACD remains slightly bullish with histogram building positive momentum, and Stoch RSI is trying to curl back up from mid-zone — suggesting there’s still fuel for another push.
Price recently tapped the 197.80 resistance area and rejected slightly, but no breakdown yet. The 15-minute chart shows consolidation just under this resistance — a breakout above 198 could trigger continuation.
Key 1H Levels:
* Support: 194.67 → 193.52 (prior base)
* Trendline Support: Holding strong since August 1
* Resistance: 197.85 → breakout level
* Target: 200 psychological + 202.5 swing fib extension
15M Intraday View:
* Price is wedging into resistance — either a breakout over 198 or a rejection back to 195 expected soon.
* If VWAP holds and price reclaims 197.50 quickly, bulls have a strong case to ride momentum toward $200.
* If 195 breaks, momentum may unwind to 193.5–194 demand zone.
🧠 GEX & Options Sentiment
Based on the GEX snapshot:
* Major Call Wall sits at $200, which is also the Highest Net GEX zone. Dealers will likely hedge short if we push into that zone, causing momentum to slow down or reverse.
* Clustered resistance: 197.85–200 is loaded with GEX7–GEX10 and call wall volume.
* Current Price (~196.09) is sitting right under the 2nd Call Wall at 197.65 (72.65%) and 3rd Call Wall at 195.65 (29.69%).
On the downside:
* GEX9 at 190 is a critical support with positive net gamma, so dips to that level may get bought.
* Below that, HVL at 188 and Put Walls at 185 / 182.5 could act as deeper demand zones.
Options Metrics:
* IVR: 21.9 → relatively cheap premiums
* IVx Avg: 33.8 (IV contracting slightly, -1.11%)
* Call Bias: 10.9% → bullish but not euphoric
📌 Trade Thoughts
Bullish Setup (if breakout over 198):
* Entry: 198.10+
* Target 1: 200
* Target 2: 202.5
* Stop: <195.50
Bearish Rejection (if fails under 197.85 again):
* Entry: <195.00
* Target 1: 193.5
* Target 2: 190.5 (GEX9)
* Stop: >198
Conclusion:
GOOGL is coiling just below major gamma resistance. A clean breakout over 198 could trigger a short squeeze toward $200+. However, failure to break and a rejection from this zone could unwind gains quickly toward 194 or lower. Watch VWAP and trendline closely for intraday guidance.
This analysis is for educational purposes only and does not constitute financial advice. Always do your own research and trade responsibly.

GOOGL Poised for a Breakout! Aug. 5GOOGL Poised for a Breakout! Key Gamma Levels Driving the Next Move 🚀
Technical Analysis & GEX Insights
GOOGL has been grinding higher after finding support around the 185–186 zone and holding the bullish recovery trend. Price is now consolidating just under 195, setting the stage for a potential breakout toward 200+ if momentum persists.
From the GEX (Gamma Exposure) perspective, the highest positive Net GEX & major CALL resistance wall sits around 200, which also aligns with a big liquidity magnet for option dealers. If price can clear and hold above 195–197, dealer hedging could accelerate upside moves toward that 200–202.5 target.
On the downside, the HVL (High Volume Level) support sits around 185, with additional PUT support at 182.5. Losing this level could quickly invite selling pressure back toward 175.
15-Minute Chart View (Short-Term Setup)
Short-term trend remains constructive, but buyers need to hold 192.5–193 intraday to keep the upward bias intact. A break below 192 could trigger a quick retest of 190–189, while sustained strength above 195 opens the path to 197–200 in the coming sessions.
My Thoughts & Suggestions Based on GEX
* Bullish Scenario: Above 197, consider 195/200 call spreads or straight calls with short-dated expiries for momentum.
* Bearish Scenario: Failure at 195–197 could provide a short scalp opportunity back toward 192–190; consider small put positions or debit spreads targeting 190–188.
* Neutral/Wait Mode: If price chops between 192–195 without clear volume expansion, better to wait for a decisive break.
Disclaimer:
This analysis is for educational purposes only and does not constitute financial advice. Trading involves significant risk, and you should always do your own research and manage risk appropriately before entering any position.
$GOOG Eyes Breakout Above $198Currently at $197.12, NASDAQ:GOOG is trading above both its 50-period SMA (~$196.00) and 200-period SMA (~$192.50) on the 30-minute chart. The trend remains bullish with support holding firm at $192.50, and bulls are watching closely as the price flirts with resistance near $198.75. This steady grind higher signals strength and trend continuation. Using UltraAlgo Optimizer to catch the next gorgeous set-up — charting tomorrow’s giants with UltraAlgo

GOOGL Forecast – Dual AI Model Confirmation📊 GOOGL Forecast – Dual AI Model Confirmation
🔹 Posted by WaverVanir | VolanX Protocol
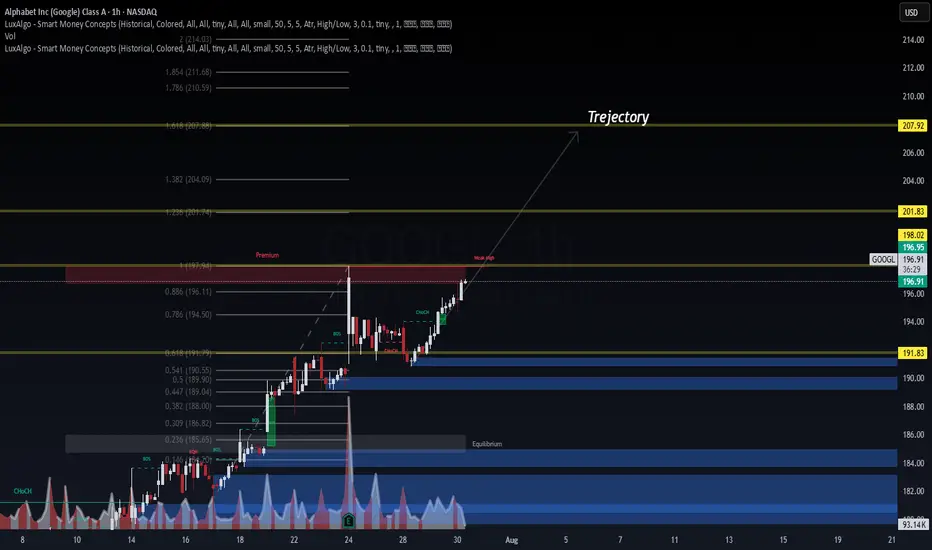
NASDAQ:GOOGL is showing strong bullish structure backed by both Smart Money Concepts (SMC) and AI model consensus.
🧠 VolanX AI Protocol Forecast (30-Day)
🎯 Target: $223.08 (+13.3%)
📈 Accuracy: 98.2%
📉 Drawdown: 0.00% (Backtested)
🧮 Sharpe Ratio: 7.70
🔵 Rating: Strong Buy
📉 WaverVanir DSS Model (Sentiment Score: 83)
🔸 30-Day Target: $198.47
🔸 Micro pullback expected before resuming uptrend
🔸 Ideal for refining short-term entries
🔍 SMC Structure:
BOS + CHoCH Confirmed
Premium zone at $197.94 cleared
1.236 Fib target: $201.83
1.618 Fib confluence: $207.92
Trajectory path = $223.08 if liquidity extends
📌 Strategy:
Entry: ~$196.95
TP1: $200.89
TP2: $223.08
SL: $188.80
R:R ~ 3.2:1
📢 Signal powered by WaverVanir DSS + VolanX Protocol
This is institutional-grade AI meets market structure.
#GOOGL #VolanX #WaverVanir #AITrading #SmartMoneyConcepts #SMC #Fibonacci #SwingTrade #Forecast #TradingView #StockSignals #InstitutionalAlpha #DecisionSupport #MachineLearning #DSS
$GOOG: Wired Paths🏛️ Research Notes
Examining interconnection:
Progression started with highs expanding until some point where contraction of both time and price difference of those highs.
Being aware of its geodesics, I choose to map the surface area of that transformation. Hence, I ended up with this structure.
Sierpinski Fibs show structural "opportunity cost" of price giving up either trajectory.

Alphabet Inc. (GOOGL) – Multi-Year Fibonacci Expansion Outlook📈 Alphabet Inc. (GOOGL) – Multi-Year Fibonacci Expansion Outlook
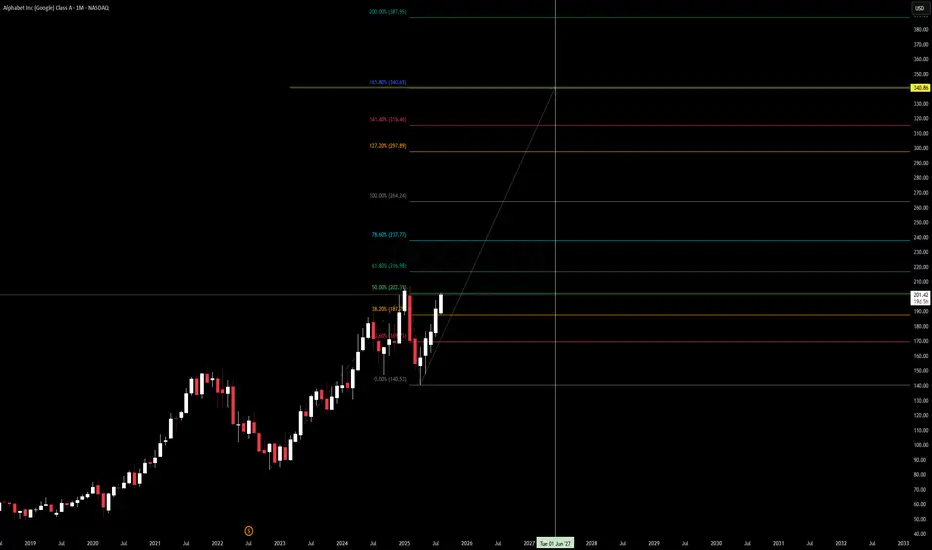
Timeframe: 1M | Horizon: 2025–2027
🔍 Technical Overview
Alphabet (GOOGL) has maintained a strong monthly uptrend after reclaiming the 50% Fibonacci retracement at $202.39. Price action is showing higher lows since late 2022, signaling accumulation and long-term institutional positioning.
Key Fibonacci levels plotted from the 2022 low to the 2025 projected swing high suggest:
61.8%: $216.98 – Key breakout confirmation level.
78.6%: $237.77 – Strong resistance zone, potential partial profit area.
100%: $264.24 – Medium-term bullish target.
127.2%: $297.89 – First major expansion target into 2026.
161.8%: $340.69 – High-probability target for late 2026/early 2027 if macro tailwinds remain.
200%: $387.95 – Stretch target under euphoric conditions.
📊 Macro & Fundamental Context
Earnings Resilience – Alphabet continues to deliver double-digit revenue growth, fueled by Search, YouTube, and Google Cloud. Margins remain robust despite AI-driven capex expansion.
AI Adoption Cycle – Integration of Gemini AI across Search and Workspace could unlock significant incremental revenue and defend market share from competitors like MSFT/OpenAI.
Digital Ad Market Recovery – Global ad spend is rebounding as consumer confidence stabilizes; this benefits Alphabet’s core segments disproportionately.
Rate Policy Shift – With the Fed pivoting towards a neutral-to-dovish stance in late 2025 projections, mega-cap growth valuations may expand further.
📅 Outlook & Targets (24-Month Horizon)
Base Case: $264.24 by mid-2026 (+31% from current levels).
Bull Case: $297.89–$340.69 by late 2026 to early 2027 (+48%–69%).
Bear Case: Failure to hold $187 support could revisit $167–$140 range.
⚠ Risk Factors
Regulatory pressures in the U.S. and EU targeting antitrust and advertising models.
AI monetization lag versus expectations.
Macro shocks (geopolitical, recessionary) compressing tech multiples.
📝 Trading Plan (Not Financial Advice)
I’m watching the $216–$218 zone closely — a clean monthly close above here strengthens the path toward $237 and beyond. Pullbacks toward $187–$190 could be attractive for positioning, provided macro data supports risk-on sentiment.
📌 Disclaimer:
This analysis is for educational purposes only and does not constitute financial advice. Past performance is not indicative of future results. Always do your own research and consult a licensed financial advisor before making investment decisions.
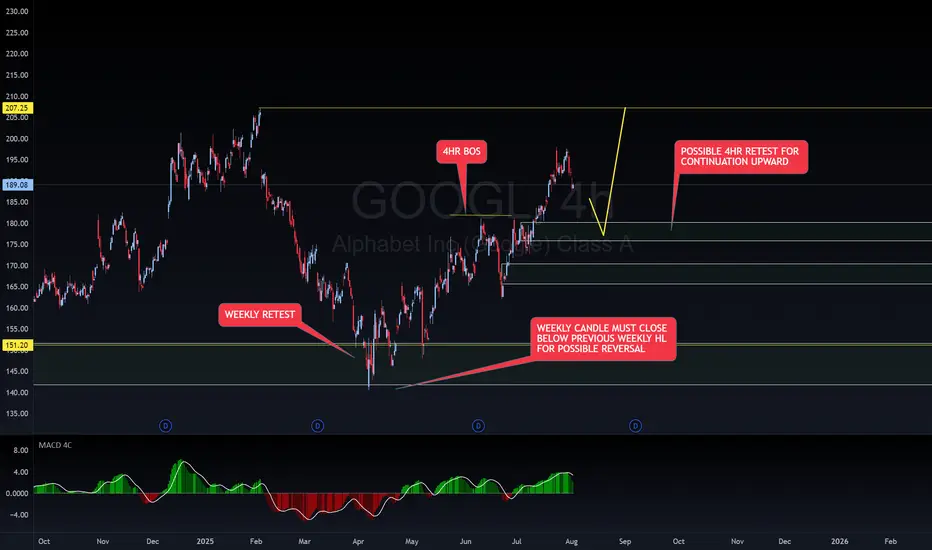
GOOGLE BUY SET UPGOOGLE is on an overall WEEKLY uptrend, coming off of a WEEKLY retest. Within that retest, we have a 4HR BOS. Waiting for 4HR retest in on of my zones for continuation to previous high. A WEEKLY candle would have to BREAK and CLOSE below the previous WEEKLY HL for possible reversal. Happy trading
~~~~I want everyone to succeed
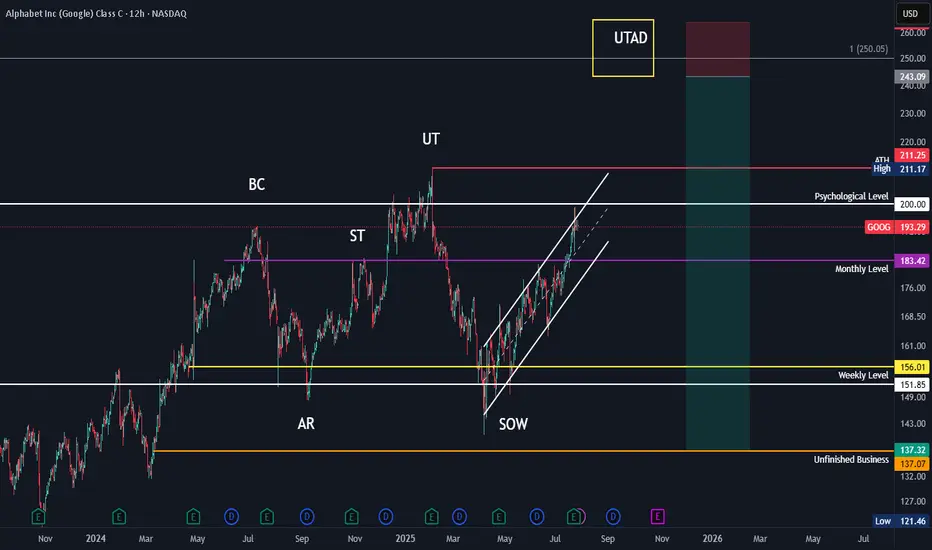
Google in a distributive phase?Could be printing a distribution here. Early signs, so very early on this idea. Would need to see PA evolve like showed in the graph. Alternatively if it makes a HH, it could be printing a UTAD. Either way, I'll be looking for signs whether Wyckoff Distribution does indeed play out.

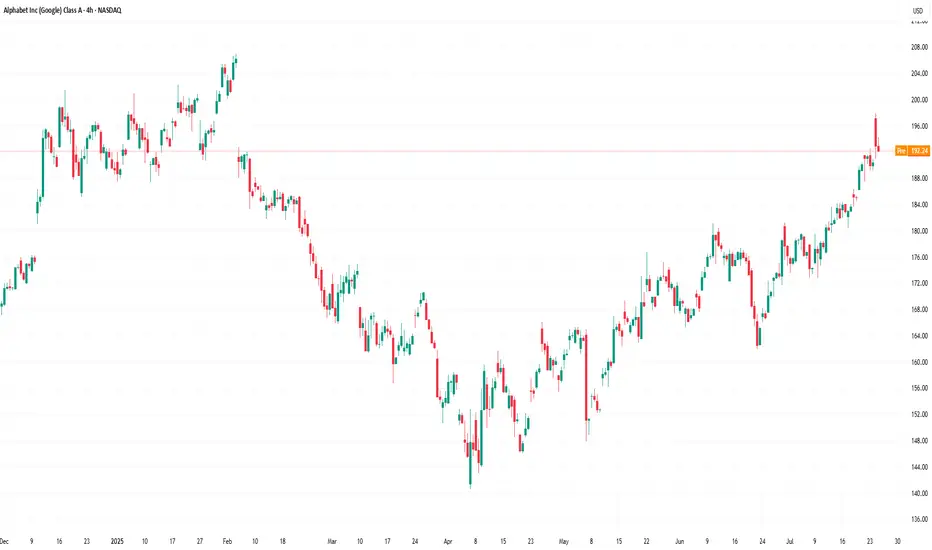
Waiting for a buy trigger.Google stock is at a good spot where it could make a strong upward move. At this price level, we see multiple confluences both in terms of trend and from the perspective of indicators and oscillators. So, if it manages to break through this level, the price could move nicely.
Google HTF Swing Short Wyoff Distribution PatternBased off HTF Wykoff Distribution Pattern. Overall target top 250ish Based off fibtrend/extensions. Followed by a ABC corrective pattern to play out over several months.
Google Buyers Entered Seller Territory.Hello, I am the Cafe Trader.
To finish off our series of the MAG 7 we have GOOGL up next.
If you have been keeping up, I will offer insight into Long term and short term interest. Google has taken out a key sellers on July 21st, and also closed inside the supply zone. This is very bullish, bulls have not got much pushback from the bears, suggesting this could test the highs again, and prime itself for a breakout.
Long term price guide helps you align a buy area with your conviction. I will update the price as of friday's close (today)
Long Term
Aggressive: $179 - If we close today above the bottom of supply line, then I would suggest this aggressive price adjust to 187.50
Fair Sentiment $166 - 173 - Between the big buyers and the strong demand. Also having the trend to support adds a 3rd strength.
Extreme Deal $140-148 - If you can catch a deal here, best to snatch it up. Alot of Big money wil be doing the same.
Short Term
weakness in the supply area is suggesting a run to the top. Trying ot get in here can be tricky. Since today is friday, the close is extremely important to see how our next week will be framed. So here I have 2 Bullish scenarios to help you find opportunity for GOOGL.
Green Scenario
Yes its possible it will run strait up into the top of supply, as a trader, you don't want to be that buyer just yet. I wouldn't personally feel great about trading the green line scenario without seeing a real buyer step into the market. So if we can Find a real buyer, we will play off of them and rirde to the top.
No entry or price targets on this one yet.
Red Scenario
This scenario has a real buyer, and personally I think is a safer trade to take (as of right now). With this squeeze that's happening, there is a good chance at some point there will be buyers getting exhausted and shorts getting a grip on this. This is why I would not buy "top of demand" but would look to get close as I could to the strong demand. and then a ride back to the "Top of Supply"
Entry: 175
Stop: 170
Partial Profit: (when the sellers step in, thats our first TP)
Target: 206
That's a wrap on our MAG 7 series, Happy Trading and we will see you next time.
Next week we are going to chart out Crypto, if you have any specific suggestions you want to see me chart, comment below.
@thecafetrader

Alphabet (GOOGL) extends its rally on upbeat 2Q earnings
US equities continue to post record highs, driven by stronger-than-expected 2Q earnings and optimism over ongoing trade agreements. Alphabet’s (GOOGL) Q2 results reaffirmed the accelerating pace of AI-led growth. The company’s cloud revenue surged 32% YoY, up from 28% in 1Q, and it raised its full-year capex guidance from $75B to $85B.
Alphabet (GOOGL) remains firm within its ascending channel. The price solidly holds above both EMAs, indicating the potential extension of bullish momentum. If Alphabet (GOOGL) holds above EMA21, the price may gain upside traction toward the previous high at 198.00. Conversely, if Alphabet (GOOGL) breaks below the support at 189.50, the price could retreat to the next support at 184.30.

Alphabet (GOOGL) Stock Chart Analysis Following Earnings ReleaseAlphabet (GOOGL) Stock Chart Analysis Following Earnings Release
Earlier this week, we highlighted the prevailing bullish sentiment in the market ahead of Alphabet’s (GOOGL) earnings report, noting that:
→ an ascending channel had formed;
→ the psychological resistance level at $200 was of particular importance.
The earnings release confirmed the market’s optimism, as the company reported better-than-expected profits, driven by strong performance in both its advertising and cloud segments.
In his statement, CEO Sundar Pichai noted that AI is positively impacting all areas of the business, delivering strong momentum.
The company is expected to allocate $75 billion this year to expand its AI capabilities.
As a result, Alphabet (GOOGL) opened yesterday’s trading session with a bullish gap (as indicated by the arrow). However, as the session progressed, the price declined significantly, fully closing the gap.
This suggests that:
→ the bulls failed to consolidate their gains, allowing the bears to seize the initiative;
→ the ascending channel remains valid, with yesterday’s peak testing its upper boundary;
→ such price action near the $200 level reinforces expectations that this psychological mark will continue to act as resistance.
It is possible that the positive sentiment following the earnings report may weaken in the near term. Accordingly, traders may consider a scenario in which Alphabet’s (GOOGL) share price retraces deeper into the existing ascending channel. In this case, the former resistance levels at $180 and $184 may serve as a support zone.
This article represents the opinion of the Companies operating under the FXOpen brand only. It is not to be construed as an offer, solicitation, or recommendation with respect to products and services provided by the Companies operating under the FXOpen brand, nor is it to be considered financial advice.
Google: A compelling buy at the current priceHello,
As Warren Buffett famously said, "Be fearful when others are greedy, and greedy when others are fearful." This mindset is particularly relevant right now with Alphabet Inc.
Despite being a company whose products we use daily—and will likely rely on even more in the future—Alphabet's stock recently declined following comments from Apple’s Eddie Cue regarding a drop in Safari search traffic. This has sparked concerns about Google's dominance in search and its ad revenue streams. Analysts are also highlighting growing competition from AI-driven platforms such as OpenAI, Grok, and Perplexity, raising questions about the future growth of Google Search.
While the headlines may seem discouraging, we remain confident in Google’s enduring leadership in the search space, underpinned by its unmatched scale, infrastructure, and user base. We also believe the market continues to underestimate how far ahead Google truly is in artificial intelligence.
In our view, this dip represents a strategic buying opportunity for long-term investors. Below is our in-depth analysis of Alphabet and why we believe it remains a strong investment.
Alphabet, Inc is a holding company, which engages in the business of acquisition and operation of different companies. Google Services includes products and services such as ads, Android, Chrome, devices, Google Maps, Google Play, Search, and YouTube. Google Services generates revenues primarily from advertising; fees received for consumer subscription-based products such as YouTube TV, YouTube Music and Premium, and NFL Sunday Ticket, as well as Google One; the sale of apps and in-app purchases and devices.
KEY NOTES FROM THE Q1 2025 EARNINGS CALL
Revenue up to $ 90.23 Billion (Q1 2024: $ 80.54 Billion)
Operating income for quarter one 2025 at $ 30.61 Billion (Q1 2024: $ 25.47 Billion)
Net income for quarter one 2025 at $ 34.54 Billion (Q1 2024: $ 23.66 Billion)
Diluted Earnings per share closed at $ 2.81 as at 31st March 2025 (2024: $ 1.89). Alphabet’s Board of Directors declared a quarterly cash dividend of $0.21 representing a 5% increase from the previous quarterly dividend of $0.20.
Cash and cash equivalents remained flat as of the end of March 31 2025 at $ 23.26 Billion (2024: $ 23.47 Billion)
Google advertising continues to do the heavy lifting for the alphabet business contributing $ 66.89 Billion of the total $90.23 Billion. Google Services includes products and services such as ads, Android, Chrome, devices, Google Maps, Google Play, Search, and YouTube. Of this amount, the breakdown is as below
•Google search & other: $ 50.70 Billion
•Youtube ads: $ 8.93 Billion
•Google Network: $ 7.26 Billion
Other services offered by the platforms contributed revenues as below
Google subscriptions, platforms & devices: $ 10.38 Billion
Google cloud: $ 12.26 Billion
Other bets: $ 450 million. Other Bets is a combination of multiple operating segments that are not individually material.
Hedging gains: $ 260 million
The company announced a share buyback program of up to $70 billion of its class A and class C shares. The buy backs will be executed through open market purchases or through privately negotiated transactions.
Business Opportunities/Strengths
Alphabet’s advertising business is firmly embedded in digital advertising budgets, allowing it to capitalize on the ongoing growth in digital ad spending.
The significant cash flows from advertising enable Alphabet to reinvest in growth areas like Google Cloud, AI-enhanced search, and innovative ventures such as Waymo. (Waymo is Alphabet's autonomous driving technology subsidiary, focused on developing self-driving cars and related technologies.)
With a strong foothold in the public cloud market, Alphabet has a substantial opportunity as a major provider for enterprises transitioning to digital platforms.
Risks to consider
Although Alphabet is working to diversify, text-based advertising remains its primary revenue source, presenting a concentration risk.
Ongoing investments in emerging, sometimes unproven technologies through its Other Bets segment continue to strain cash flows.
Increasing regulatory scrutiny of Alphabet's search dominance worldwide could lead to significant market disruptions through structural reforms.
Recommendation
We view Alphabet as a solid business with diverse solutions ranging from advertising, cloud business and driverless cars as well. While we acknowledge that the antitrust cases have continued to make headlines, we encourage investors to remain invested and focused on the business’s strengths. The business has unique products that will have the ability to remain leaders for a very long period of time. Android is the operating system for the majority of the world’s smartphones with more than two-thirds of all smartphones in the world running it. Virtually all smartphones, other than those manufactured by Apple, run on Android. We see this remaining as a google strength for a very long time. The Google Play Store’s unmatched ecosystem creates significant barriers for competing operating systems, limiting their access to critical applications. The recent correction on US technology companies provides us with a solid buying price for some of these great companies. Alphabet alone corrected by about 31% and has since bounced back.
We see the current price as a great entry price for long term investors based on both technical and fundamental analysis with a target price of $ 203.

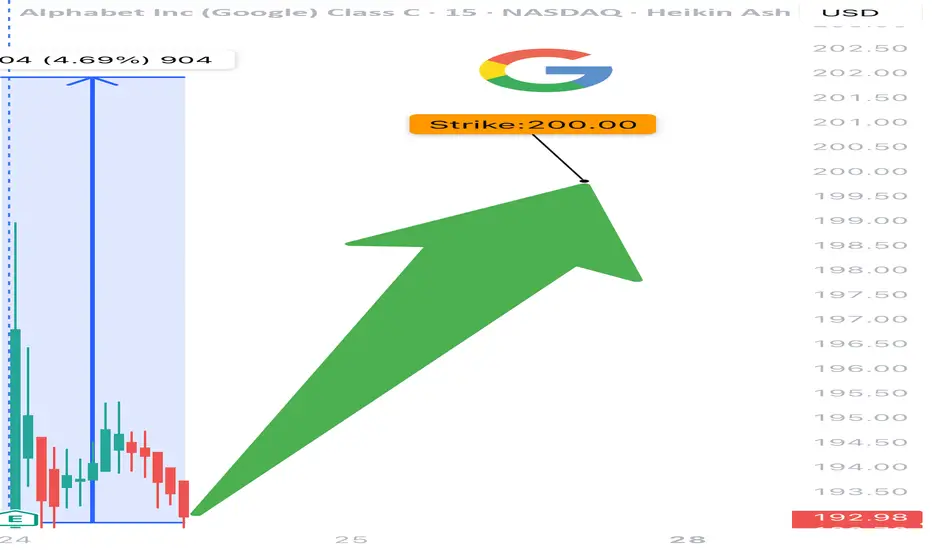
GOOGL TRADE IDEA (07/24)
🚨 GOOGL TRADE IDEA (07/24) 🚨
💥 Big institutional flow. 1 DTE. High gamma = high reward (⚠️ high risk too)
🧠 Quick Breakdown:
• Call/Put Ratio: 2.44 → ultra bullish
• Weekly RSI climbing (67.3) 📈
• Daily RSI falling from 77.5 → 🔻 short-term pullback risk
• Reports split: trade or wait? We’re in.
💥 TRADE SETUP
🟢 Buy GOOGL $200 Call exp 7/25
💰 Entry: $2.09
🎯 Target: $3.14–$4.18 (50–100%)
🛑 Stop: $1.25
📈 Confidence: 70%
⚠️ Expiry in 1 day = tight execution needed. Gamma can cut both ways. Watch it like a hawk. 👀
#GOOGL #OptionsFlow #CallOption #GammaSqueeze #TechStocks #UnusualOptionsActivity #TradingView #StockAlerts #BigMoneyMoves #DayTrading #OptionsTrading
EOY based on yesterday's earnings and the flywheel effect# Alphabet's Accelerating Flywheel: Q2 2025 Earnings Validate the Strategy
technicals grounded in an anchored pitchfork hinged on the pre-covid levels (covid bottom just makes the path too aggressive for EOY) and fib retracements of the 2022 bear market decline. General and simple targets since moving averages aren't providing much clarity. Single stock analysis is even more voodoo than large sector indexes, so I'll focus on fundamentals instead:
## The Flywheel In Action: Q2 2025 Results
Alphabet's blowout Q2 2025 earnings provide concrete evidence that their integrated AI flywheel is already spinning faster. **Revenue grew 14% to $96.4 billion, crushing expectations**, while the company raised its 2025 capital expenditures from $75 billion to **$85 billion**—a bold investment that initially spooked some investors but actually signals the flywheel's acceleration.
### Why the $85 Billion Capex Increase is Strategic Genius
The additional $10 billion isn't just spending—it's **strategic reinvestment in the flywheel's core components**:
**Infrastructure Dominance:** Google Cloud revenue surged 32% to $13.6 billion, now approaching a $50+ billion annual run rate. The capex increase funds the massive data centers and TPU clusters needed to serve exploding AI demand.
**Competitive Validation:** Even OpenAI, Google's biggest AI rival, is now renting Google's TPU chips to power ChatGPT—choosing Google's proprietary hardware over Nvidia GPUs for cost-effective inference. This partnership alone validates the integrated hardware-software advantage.
**Market Leadership:** With AI Overviews reaching 2+ billion users (up from 1.5B last quarter) and Gemini hitting 450+ million users, Google is proving it can deploy AI at unprecedented scale while generating immediate revenue.
## The Core Flywheel System
**The Engine:** World-class AI research (DeepMind, Google AI) creating increasingly capable models that serve as tools for invention, not just products. Gemini's rapid user growth proves the models are competitive.
**The Fuel:** Search and YouTube revenue provides patient capital for long-term moonshots, while diverse data from billions of users continuously improves AI models. Q2's strong advertising performance ($64B+) funds the entire system.
**Custom Hardware Advantage:** Proprietary TPUs optimized for their AI software create faster, more efficient training and inference than competitors using general-purpose chips. OpenAI's adoption proves TPUs offer superior cost-performance.
**The Multiplier:** Quantum computing research that could eventually solve problems impossible for classical computers, creating step-change advantages in materials science and optimization.
## AI Integration Across the Ecosystem: The Ultimate Moat
Alphabet's true competitive advantage lies in **embedding AI across their existing billion-user platforms**, creating compound defensibility:
**Search Dominance:** AI Overviews now appear in 2+ billion monthly searches across 200+ countries, fundamentally changing how users interact with information while maintaining Google's search monopoly. Users increasingly expect AI-powered results, making switching costs even higher.
**Productivity Lock-in:** Gmail's Smart Compose, Google Docs' AI writing assistance, and Sheets' intelligent data analysis create sticky enterprise and consumer habits. Once teams adopt AI-enhanced workflows in Google Workspace, migration becomes exponentially more difficult.
**Developer Ecosystem:** Google's coding tools (Colab, Android Studio) now feature AI pair programming, while languages like Go and Dart benefit from AI-optimized development. This creates a generation of developers trained on Google's AI tools.
**Educational Moat:** Chromebooks in schools now include AI tutoring and personalized learning, creating habits among students who will become tomorrow's decision-makers. Google for Education's AI features make alternative platforms seem primitive.
**Entertainment Integration:** YouTube's AI-powered recommendations, creator tools, and content moderation have become so sophisticated that creators and viewers alike can't imagine the platform without them. This strengthens YouTube's dominance over TikTok and other competitors.
**Mobile and Browser Dominance:** Android and Chrome's AI features (Smart Reply, intelligent autofill, predictive text) create seamless experiences that competitors struggle to match without Google's data advantages.
## Near-Term Flywheel Accelerators
**Physical AI & Robotics:** Moving from digital-only AI to robots that can perceive and manipulate the physical world. Waymo has now driven 100+ million autonomous miles, generating unique physical-world training data.
**AI Biology:** DeepMind's protein folding breakthroughs and Isomorphic Labs' drug discovery pipeline could create massive pharmaceutical revenues while advancing the core AI engine.
**AI Materials Science:** Already discovering thousands of new materials that could dramatically improve batteries, semiconductors, and other hardware across all ventures—feeding back into better TPUs and infrastructure.
## The Compounding Network Effects
**Data Flywheel:** More users → More training data → Better AI models → Better products → More users. AI Overviews now drive 10%+ more queries for the types of searches that show them.
**Revenue Flywheel:** AI success → Higher cloud/advertising revenue → More R&D investment → Better AI → Market expansion. Google Cloud's 32% growth funds continued AI leadership.
**Talent Flywheel:** Best AI infrastructure → Attracts top researchers → Better models → More ambitious projects → Attracts even better talent. The recent $2.4B Windsurf acquisition shows Alphabet winning the talent war.
**Infrastructure Flywheel:** More AI demand → Larger TPU deployments → Better hardware optimization → Lower costs → More competitive offerings → More demand.
**Ecosystem Lock-in:** AI features across Gmail, Docs, YouTube, Search, and Android create switching costs that compound across products. Users don't just leave Google Search—they'd have to abandon their entire digital workflow.
## The Strategic Moat Widens
While competitors excel in individual areas, Alphabet's advantage comes from **deep integration creating compound effects**:
- **Capital Moat:** The $85B capex commitment (13% increase from 2024) exceeds most competitors' total revenues
- **Integration Moat:** OpenAI using Google TPUs despite being competitors proves the hardware-software integration is unmatched
- **Scale Moat:** 2+ billion AI Overview users and $50B+ cloud run rate create network effects competitors can't replicate
- **Ecosystem Moat:** AI embedded across Search, Gmail, YouTube, Android, Chrome, and Workspace creates compounding switching costs
- **Innovation Velocity:** Time from AI research to deployed products at billion-user scale continues compressing
## The Key Insight
The Q2 earnings reveal that Alphabet isn't just building an AI company—**they're building the infrastructure that accelerates invention itself**. Each breakthrough feeds back into the system: new discoveries generate revenue that funds more research, create better tools for the next breakthrough, and attract top talent.
More importantly, they're embedding AI so deeply into users' daily workflows—from Gmail to YouTube to Search—that switching becomes not just inconvenient but practically impossible. When your email, documents, entertainment, and information all work seamlessly together through AI, why would you ever leave?
The $85 billion capex increase signals management's confidence that they're approaching "escape velocity"—where their innovation rate becomes impossible for competitors to match. While others debate AI spending, Alphabet is already demonstrating profitable AI deployment at unprecedented scale while simultaneously investing in the next acceleration phase.
**The Bottom Line:** Alphabet's integrated flywheel of AI research, proprietary hardware, massive data, and patient capital is creating an innovation velocity that competitors are finding increasingly difficult to match. But their true moat is embedding AI so deeply into billions of users' daily habits that the entire Google ecosystem becomes indispensable—and the Q2 results prove this strategy is already working.

GOOG Earnings Setup (2025-07-23)
📈 GOOG Earnings Setup (2025-07-23) 🚀
🔥 STRONG BULLISH BIAS – 85% Confidence
Alphabet (GOOG) is set to report after market close. Here’s why this setup is 🔥:
⸻
📊 Fundamental Highlights:
• 💸 TTM Revenue Growth: +12.0%
• 🧾 Profit Margin: 30.9%
• 💯 Earnings Beat Rate: 8/8 last quarters
• 📈 EPS Est: $8.95
• 🎯 Forward P/E: Attractive in the AI-dominant market
👉 Score: 9/10
⸻
🔍 Options Market Flow:
• 🚀 Heavy Call buying at $195 strike
• 💰 Implied Move: ±5.12%
• 🛡️ Light Put hedging at $190 shows cautious optimism
• 📉 IV Rank: 0.75 (Elevated but tradable)
👉 Score: 8/10
⸻
🧭 Technicals:
• 🔺 RSI: 73.32 (strong momentum)
• 🔼 Above 50/200 MA
• 🔵 Support: $190.00
• 🔴 Resistance: $200.00
👉 Score: 8/10
⸻
🌍 Macro/Sector Tailwinds:
• 🌐 AI & Ads tailwind still fueling growth
• 📡 Sector leadership + resilient biz model
👉 Score: 9/10
⸻
🛠️ Trade Idea (High Conviction)
🔹 Ticker: NASDAQ:GOOG
🔹 Direction: CALL
🔹 Strike: $195.00
🔹 Expiry: 07/25/2025
💵 Entry Premium: $3.95
🎯 Target Premium: $11.85 (200%)
🛑 Stop: $1.98 (50%)
📅 Entry: Before 07/23 Close (Pre-Earnings)
⸻
📌 Risk-Reward
• Max Loss: $395 per contract
• Target Gain: $1,190 per contract
• Break-even: $198.95
• ⏳ Time-sensitive: Close post-earnings if flat (avoid IV crush)
⸻
🚨 Summary
💥 GOOG looks primed for an upside breakout. Strong fundamentals + bullish technicals + aggressive options flow make this a top-tier earnings play.
🔔 Watch $195–$200 zone post-earnings.
💬 Drop your thoughts 👇 — are you playing GOOG this earnings?

Open AI building it's own Browser- Open AI building it's own Browser. They have the talent to build it.
- Apple buying Perplexity AI
- MARKETSCOM:GOOGLE chrome isn't the best. I find Firefox better than Chrome but that's subjective. There's no stickiness in web browsers honestly. It's just that there are no good options.
- Recently, Google chrome added some weird looking AI summarizer on top which must be reducing number of organic hits to the website.
- I'm bullish long term but bearish short term. Open AI is really disruptor and has strong talent density better than Google in my opinion.
