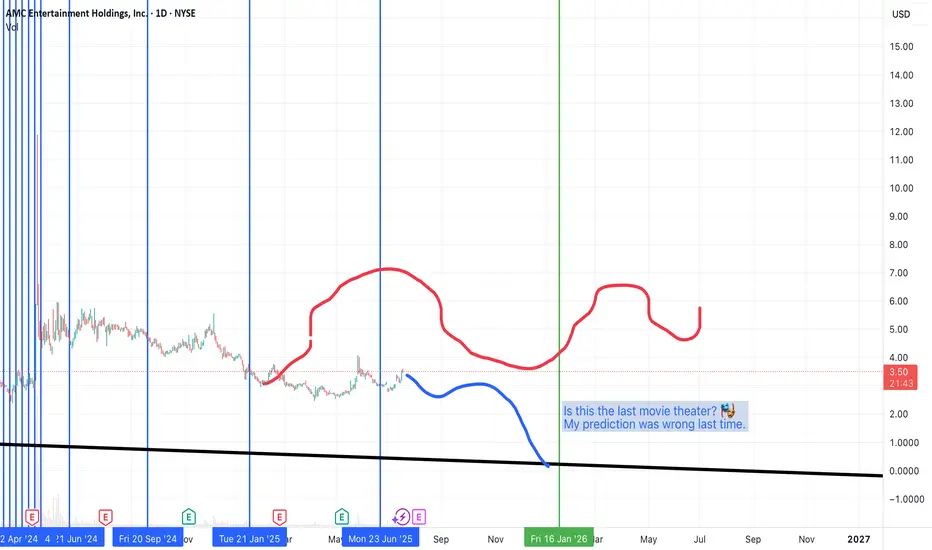
AMC | Long-Term Setup BrewingAMC has been a battlefield stock for retail traders, and while the meme frenzy has calmed, the chart shows signs of a long-term consolidation that may lead to a breakout.
We’re not chasing hype we’re playing levels. The current zone offers asymmetric risk/reward for patient swing or position traders looking for a reversion move back toward key psychological and technical levels.
🔍 Entry Zones:
✅ Market Price: ~$2.99 (initial momentum position)
🧲 Pullback #1: $2.75 (former pivot + fib level)
🧨 Pullback #2: $2.50 (key support floor and high-risk/reward entry)
🎯 Profit Targets (Swing/Position):
🎯 TP1: $3.30 – reclaim of early resistance
🎯 TP2: $4.00 – volume spike zone
🎯 TP3: $5.00+ – potential sentiment surge / short squeeze zone
📢 Disclaimer: This is not financial advice. Always manage your own risk and do your own due diligence.
AH91 trade ideas

AMCAMC going to $0.00¢ the Last movie theater!!
Looks like theres not going to be any movies played at AMC guys... Better luck next time. >.>
Call your mom. This stock has taught me how to trade. I found it. I bought it for the first time in 2021 and that's how my trading journey began.
Now in July of 2025, I think we might see movement we have been waiting for over the past years.
I remembered a documentary I watched over 15 years ago about a trader making unreal returns (1000s% per year) discussing his strategy. The key points I remember are the deviation from the SMAs. Stocks, that are laggers, kissing/sitting at/over moving averages, especially sitting right above the 100 day moving average for a prolonged period of time (just watch BX:GMES weekly on the 100 SMA;)) and how those stocks see INSANE amount of gains, when they move. I wish I remebered the exact documentary. I see it coming to life in these memes, it seems.
AMC Bullish Cycle Alert – Gann Analysis Signals a 60%+ Move!📊 Key Insight:
According to our proprietary Gann time cycle and technical analysis, AMC is entering a strong bullish window, with a minimum expected upside of 60%.
🟢 Bullish Case Highlights:
✅ W–X–Y–X–Z corrective structure potentially completed.
🔁 Multiple bullish divergence signals across the recent lows.
📅 Time Cycle Tops: 21st July – 2nd September 2025.
🎯 Minimum Price Target: $4.90 – $5.30
💥 Extended Fibonacci Target: $11.88
🔴 Invalidation Level: A weekly close below $2.67 invalidates this setup.
📌 Strategy:
Early accumulation within the $2.80–$3.20 range may provide strong risk-reward setups for swing traders. Watch for volume and momentum confirmation during July.
🔍 Vital Direction View:
This setup combines Elliott Wave structure, Fibonacci symmetry, and Gann time analysis, forming a high-probability inflection zone. If confirmed, this could mark the start of a new bullish cycle for AMC.

AMC Entertainment Holdings | AMC | Long at $3.66First, I'm not an " NYSE:AMC APE" and have zero interest in becoming one. Second, don't trade NYSE:AMC unless you are fully aware the investment could go to zero or the company may devalue your trade via share dilution or other means (i.e., don't simply do as I do or blindly follow anyone else's moves, for the matter).
With that aside, I started a position/gambling play today in NYSE:AMC at $3.66. The reason is 80% technical analysis and 20% fundamentals.
Technical Analysis:
The blue line on the chart represents an average true range (ATR) from a historical simple moving average (SMA) that I use for trading. For simplicity, the historical SMA is not show on the chart - just the ATR. This blue ATR line has historically been a major line of resistance and support. When it breaks through and holds, the stock goes bull - but history may not repeat. The price recently broke the blue ATR line, fell below, and the broke out again today. This may be a sign that the downward trend (overall) is changing - perhaps furthering the accumulation phase in the $3s or a gradual rise from here. And with today's breakout, I grabbed shares at $3.66.
Fundamentals
Since 2020, NYSE:AMC has shown major gains in revenue and net income (loss reduction, that is). Revenu: $1.24 billion (2020); $2.53 billion (2021); $3.91 billion (2022); 4.81 billion (2023); $4.4 billion (2024, Q1-3 only). Net Income: -$4.5 billion (2020); -$1.27 billion (2021); -$973 million (2022); -$396 million (2023); -$399 million (2024, Q1-3 only). The company is not expected to become profitable until Q4 of 2026 , but the improvements are what one would like to see.
Counter-arguments and statements the stock is junk are totally valid. But the chart is quite interesting as the company moves toward profitability (maybe...).
Targets:
$4.30
$6.00
Squeeze/mass hysteria: $18.00, $40.00, and ridiculousness: $85.00

AMC ENTERTAINMENT HOLDINGS STOCK.WEEKLY / DAILY ANALYSIS.Hello ladies and gentleman.The intrinsic value of one AMC stock under the base case scenario is 10.4 USD. Compared to the current market price of 3.35 USD, AMC Entertainment Holdings Inc is undervalued by 68%.so the is a great probability long to 5 usd.

AMC to squeeze 3-4x soon?Chart looks great, MFI seems to be trending up...lots of smart money has been getting in at the bottom.

Enjoy the Movie $AMCThis is a large broadening wedge (megaphone) pattern with Elliot W. ABCDE waves. impulsive waves are mapped within. See the red circle for a repeat of 2021 to happen in 2025. The start of very similar bottoming patterns designated by green arrows. $35-$53 range. Correction and the 1.618 target is $609 for $AMC.
July 2026 seems to be the appropriate timeline.

Squeeze Me: AMCI do not have a crystal ball
But what I do have is enough
Trade What You See..Not What You Hope For

Short term buyAMC bouncing off a strong support level. I loaded up on calls. $3.50 exp Dec 19. I believe AMC will come back up to $4. I am no expert just my thoughts on AMC

Can $AMC come back to life again? NYSE:AMC is showing some good TA on the weekly and daily chart. We are visiting lows from the past, which reminds me of when I played NYSE:AMC and it visited the COVID lows.
On both the Weekly and Daily we have the MACD in GREEN, RSI crossing MA which the weekly is showing downtrend being broke.
Daily chart Is almost or is right on the 8 day crossing the 21 day EMA. Daily is also breaking the downtrend of ~$4.40 along with breaking the 100 day SMA. Holding VWAP form the low of $2.45 on 4/4/2025.
NYSE:AMC Price as of 5/15/2025: $2.81
Need to see continuation out of the downtrend with volume
Break the resistance level of $2.81 - $2.85, which has the 100 Day SMA around the $2.83 that needs to be cleared.
Then $2.90 - $3.00 and we'll follow the Fib Levels and mark support/resistance levels as we go.
This could get spicy so buckle up knuckleheads!
NYSE:AMC Daily
NYSE:AMC Weekly

AMC Weekly Options Trade Plan 2025-05-07AMC Weekly Analysis Summary (2025-05-07)
Model Summaries • Grok/xAI Report Technicals: Short-term bearish (price below 10-day EMA) but daily MACD just crossed bullish. RSI neutral. Bollinger Bands neutral. Supports at $2.68/$2.53; resistance at $2.76/$3.00. Sentiment: Elevated VIX; mixed news (short-term weakness, long-term growth). Max pain at $2.50 implies downward pressure. View: Moderately Bullish. Recommends buying the $2.50 call at $0.26 with 50% profit target and 50% stop-loss. Confidence 65%.
• Claude/Anthropic Report
Technicals: Bullish on M5 EMAs, neutral daily EMAs. RSI rising, daily MACD positive. Resistance at $2.72, support at $2.68/$2.50. Sentiment: High VIX, negative earnings priced in, max pain at $2.50. View: Moderately Bullish. Recommends buying the $2.50 call at $0.26. Profit targets at $0.39/$0.52; stop-loss at $0.18. Confidence 65%.
• Llama/Meta Report
Technicals: Mixed—short-term bullish but daily bearish bias. RSI neutral. Bollinger neutral. MACD slightly bearish on daily. Sentiment: Rising VIX, weak fundamentals, max pain at $2.50. View: Slightly Bearish. Recommends buying the $2.50 put (premium $0.05), 50% profit target, stop if price > $2.80. Confidence 65%.
• Gemini/Google Report
Technicals: M5 bullish but M5 MACD just crossed bearish; daily MACD bullish but price below middle BB. Resistance at $2.72/$2.76; support $2.68/$2.57/$2.50. Sentiment: Elevated VIX, negative earnings, max pain at $2.50. View: Moderately Bearish. Recommends buying the $3.00 put at $0.35, targeting $0.50–$0.60, stop-loss at $0.20. Confidence 65%.
• DeepSeek Report
Technicals: Bearish daily EMAs, mixed momentum. VIX rising, max pain at $2.50. View: Moderately Bearish. Recommends buying the $2.50 put at $0.26 (incorrect premium data), target $0.52, stop-loss $0.13. Confidence 65%. Agreement and Disagreement • Agreement: Elevated VIX and negative Q1 news. Key option levels: Max pain at $2.50 is pivotal. All assign ~65% confidence to their view.
• Disagreement:
Directional bias: two models bullish vs. three bearish. Strike selection: Bulls favor $2.50 calls; bears split between $2.50 puts and $3.00 puts. Premiums cited: conflicting premium data for the $2.50 put (actual $0.05 vs. model‐used $0.26). Conclusion and Trade Recommendation • Market Direction Consensus: Moderately Bearish (3 of 5 models lean bearish; sentiment and max pain weigh more heavily in this near‐term weekly). • Recommended Trade: Buy the AMC May 9, 2025 weekly $3.00 put at $0.35. – Strategy: Naked single-leg put – Expiration: Weekly (2025-05-09) – Premium: $0.35 (within $0.30–$0.60) – Entry Timing: Market open – Size: 1 contract – Profit Target: $0.50 (≈43% gain) – Stop-Loss: $0.20 (≈43% loss) – Confidence Level: 65% • Key Risks and Considerations: Short-term bullish counter‐momentum (daily MACD positive). Sharp squeezes possible in a low‐liquidity, high‐volatility issue. Theta decay if the stock stalls above $2.80. Rapid VIX swings could inflate/deflate premium unpredictably.
TRADE_DETAILS (JSON Format)
{ "instrument": "AMC", "direction": "put", "strike": 3.0, "expiry": "2025-05-09", "confidence": 0.65, "profit_target": 0.50, "stop_loss": 0.20, "size": 1, "entry_price": 0.35, "entry_timing": "open", "signal_publish_time": "2025-05-08 08:30:00 UTC-04:00" }
Disclaimer: This newsletter is not trading or investment advice but for general informational purposes only. This newsletter represents my personal opinions based on proprietary research which I am sharing publicly as my personal blog. Futures, stocks, and options trading of any kind involves a lot of risk. No guarantee of any profit whatsoever is made. In fact, you may lose everything you have. So be very careful. I guarantee no profit whatsoever, You assume the entire cost and risk of any trading or investing activities you choose to undertake. You are solely responsible for making your own investment decisions. Owners/authors of this newsletter, its representatives, its principals, its moderators, and its members, are NOT registered as securities broker-dealers or investment advisors either with the U.S. Securities and Exchange Commission, CFTC, or with any other securities/regulatory authority. Consult with a registered investment advisor, broker-dealer, and/or financial advisor. By reading and using this newsletter or any of my publications, you are agreeing to these terms. Any screenshots used here are courtesy of TradingView. I am just an end user with no affiliations with them. Information and quotes shared in this blog can be 100% wrong. Markets are risky and can go to 0 at any time. Furthermore, you will not share or copy any content in this blog as it is the authors' IP. By reading this blog, you accept these terms of conditions and acknowledge I am sharing this blog as my personal trading journal, nothing more.

A New Beginning AMC’s story is far from over! From where I’m standing, the stock is simmering in an accumulation zone, quietly building momentum like a sleeping giant ready to roar. Are these rock-bottom prices at $2.68 the last we’ll see before this titan wakes? What’s the vibe from your side of the street? Drop your take below! #AMC #ToTheMoon

AMC: Breakout Brewing? Earnings, FOMC, and Trump Rate Cut HypeAMC is heating up, and the chart is screaming potential! Let’s dive into the current price action and why this meme stock might be gearing up for a move.
Price Action & Technicals
AMC’s daily chart is teasing a breakout. The stock is currently trading at $2.67, hugging a key resistance around $2.70-$2.80. We’ve seen it consolidate tightly after a month of grinding between $2.61-$2.92. The 50-day moving average (~$3.00) is looming as the next hurdle, and a strong close above $2.80 could spark bullish momentum. Volume has been picking up, hinting buyers are stepping in. The last notable “squeeze” on May 13, 2024, rocketed AMC to $11.87 from similar consolidation levels. Looking at the chart, $5.80 (a strong high from late 2024) is a realistic first target, but a squeeze could push higher if momentum kicks in—who knows how high?
Earnings Buzz on X
The upcoming Q1 2025 earnings on May 7, 2025, are generating chatter on X. @Ryan__Rigg
posted about the earnings date, signaling retail excitement. @StockRetail
highlighted AMC’s improving revenue and low price-to-sales ratio (~0.23), suggesting Q2 could surprise given strong box office trends. @biotech_moose
is hyped about the box office results fueling a solid earnings call. Even @CEOAdam
’s hint at potential news (per @xMarketNews
) has retail investors speculating about mergers or acquisitions. The sentiment is bullish, and options activity is ramping up, with @simulationchess
noting heavy call buying at $3-$5 strikes, which could trigger a gamma squeeze if earnings deliver.
FOMC & Trump’s Rate Cut Push
The FOMC meeting on May 6-7, 2025, is another catalyst to watch. Trump’s vocal push for rate cuts could pressure the Fed, especially with markets pricing only a 9% chance of a 25 bps cut . A dovish surprise or Trump-driven optimism could boost risk assets like AMC, especially given its meme stock sensitivity. Lower rates could fuel retail FOMO, potentially igniting a short squeeze—13.94% of the float is shorted . While nobody can predict the ceiling, the May 2024 run to $11.87 shows what’s possible when the stars align.
Squeeze Potential & Strategy
With earnings, FOMC, and Trump’s influence converging, AMC could see a volatile move. Options buying is picking up, and a breakout above $2.80-$3.00 could trigger a gamma squeeze as dealers hedge ITM calls. First target: $5.80. If momentum builds, $11.87 or beyond isn’t out of the question, but don’t get greedy—$1000 dreams are fun, but locking in profits is smarter. Always use tight stops and position sizing. This is a meme stock, so volatility is wild, and risk management is non-negotiable.
Final Thoughts
AMC’s daily chart is coiling for a breakout, earnings hype is real, and FOMC plus Trump’s rate cut narrative could light a fire. Whether it’s a quick scalp to $5.80 or a squeeze to $11.87+, the setup is intriguing. But stay disciplined—take profits when you’ve got them, and never bet the farm.
This is my personal opinion and analysis, not trading advice. Always do your own research and manage your risk carefully.

New Moon Fade Final Sand for Sqeeze!I like to call this the new moon fade, basically when we are in the new moon the market starts too sell (they use the news to inject fear, they understand that the moon effects are emotions.
We are in an area where a lot of investors will sell do to fear.
I give the two more weeks before a squeeze due to the critical point we are in. This new moon fade does not occur very often, I would say once or twice a year. Remember to take your some profits.
You gotta do what's best for you

AMC Looking Strong need to keep pushing Higher, Two WeeksAmc Looking Strong, Need to hold and push higher. In two weeks we will have a better ideas as to how it will play out. Need to break above 3.50
The Bulls are Stepping in!

AMC ready for a 30% scalp move?We have a nice channel, with a good double bottom and this seems to be a level that AMC has pumped before. Keep a tight stop and dont hold for too long in my opinion. Not financial advice.

AMC to $25?AMC in my opinion is backtesting the over shot channel. If all goes well, this may squeeze to $25 before getting back to about $10. Not financial advice.

AMC: Buy ideaOn AMC according to the configuration of the chart, we would have a high probability of having an upward trend over a time unit of one (01) hour in the event of a break of the vwap and the resistance line by buyers.

AMC Bouncing Back Up Offf Support. AMCThis appears to be a A Wave of a new zigzag that sent us to low of lows at 3.00 . Now well and truly back out of thee OBOS territory. Generally speaking, A waves do not produce momentum divergences, and this appears to be the case here as well. AB trendline, along with MIDAS has been crossed, BB%PCT crossed zero line a few candles ago and we are bullish otherwise technically.

AMC - The Last BottomI've left this chart as big as possible so you can play around with it and see what I see as much as possible.
We're bouncing off the $3.00 resistance level.
There's one more resistance below us.
$2.50. Anywhere much below that and we reach another new all-time low.
Considering we're on a bear rally (no consistent higher-highs and higher-lows in months - greatly part to capitalizing on whatever bull rally available by offering shares to reduce debt)
But considering AMC doesn't plan on offering new shares soon and the stock price is threatening to hit new all-time lows: the stock will have to decide whether this is the last bottom, or if the company is worth less than ever.
I could see a retest of the the 2.50 range. After all, every single time we've hit a bottom, we've hit it again and then dropped even lower.
There just needs one time where the stock can bounce fro an all-time low and go past "old lows".
The price popped above the 200EMA on the 4-hour chart in May of last year, which led the stock to soar from 3.57 to 13.30 in a matter of a couple candles.
I'm still waiting to see the price get pinched between the 200EMA on the daily chart (5.56 right now) and the bottom (2.40 right now).
Earnings could be a catalyst. Some Trump decision could be a catalyst. Ken Griffin having a heart attack could be a catalyst (I don't wish any pain on anyone, but some deserve what's coming more than others). It doesn't matter.
AMC is making leaps towards being a profitable business and the spring can only be wound so tight.

AMC: Bearish Channel: Buy ideaOn AMC as you can see on the chart we are in bearish channel situation so it's mean that we would have a hight probability to have an uptrend if only if we have the breakout with force the resistance line and the vwap indicator by buyers.
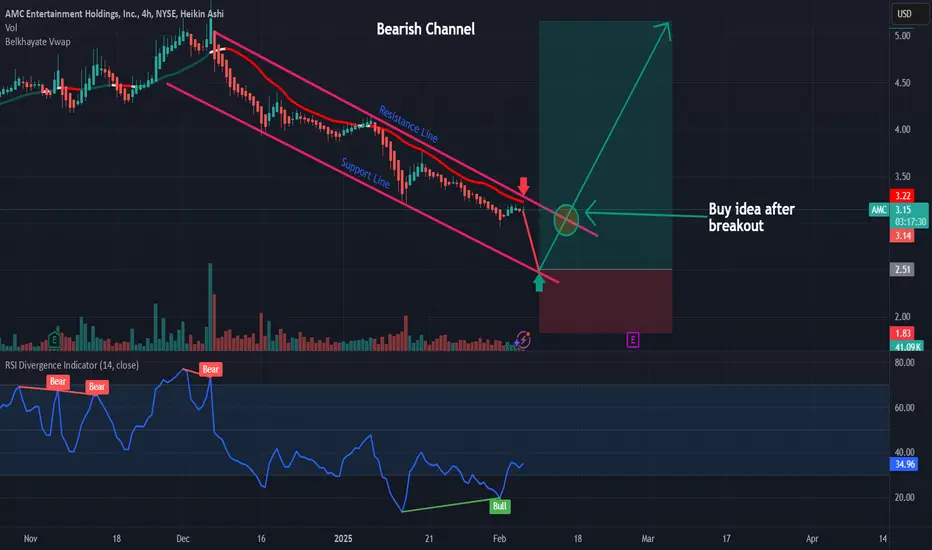
Break above 8 month resistanceThis Green trend line has been AMC's resistance since the May run-up of last year.
Right now, the price action is bouncing between it and the Red support line.
With the 4th anniversary of the first sneeze coming up, the BOJ rumored to increase interest rates to the highest level in 17 years on Friday morning, and the first FOMC meeting of the year and new Presidency being next Wednesday, I think the perfect storm is brewing for hedge funds to have to close their short positions.
If we close the week above 3.50/above the green resistance line, I am expecting volatility to the upside.
Also important to remember that at 5.66, AMC can clear $400M worth of debt, which would bring the company closer to $3.5B.
Compared to the high of $5.88B in debt it had at the end of September 2020, that is great progress.
Let's see what happens in the next couple days/week.
