AH91 trade ideas

the $210 gap fill theory... the math adds upthis is a play that i will be playing for amc.. if it plays out, the volatilty will be wild, and you'll make alot of money.. not financial advice! goodluck.. estimated time, end of january.

can amc be the fall of the usa? a path to freedomour first target.. is $13.. and if the path follows.. theres a lot of upside... be careful and do your due diligence.

$284really cool stuff, here we use indicators to help us visualize what to expect from the amc massive pump that is coming...

why the bottom is in for amc.. a lengthy talk and the paththeres huge potential in the amc chart.. don't miss it. we have bullish targets across the board.. technical analysis at work.

THE AMC FRACTAL. MILLIONAIRES WILL BE MADE, PAY ATTENTION!im making it easy. it should be easy. it won't go exactly like this, but it'll be close, almost 1:1 to a certain point then it will break.
take care, make sure to share! thanks

amc money supply secret chartlets hope that we get that move at $13.96./.. cause it could be explosive!!!!!!!!! shorts wont understand!

amc with inflation.. $238 target!lets do more theory crafting... here we use the inflation calculator to guesstimate where the next squeeze would be.

AMC Happy New year analysisBullish divergence on the daily.
Rising Rsi
Bearish price action
In the money calls or $11c. Exp. Jan 5 or further out
You’re welcome (:

AMC THE CRYSTAL BALL VISION IS A GO. BELIEVE IN ME!Trust the process guys, this is the best answer i could come up with, while studying this chart.
there is something cooking.

AMC double-bottomAMC appears to have put in a double bottom in the late $6 range with unfilled gaps to the upside

AMC Entertainment (NYSE: AMC) Stock: Buy or Sell? AMC shares are currently trading near their all-time low, despite the fact that the company's fundamentals are at their strongest since the onset of the pandemic.
AMC Is Trading at an All-Time Low
AMC Entertainment (AMC) - would be classified as a penny stock right now if it weren't for the 1-for-10 reverse stock split that the company implemented at the end of August. In fact, if it hadn't been for the reverse split, AMC — which trades for around $6 — would be worth 69 cents per share today.
AMC reached an all-time high of $551 per share in 2021 (adjusted for the reverse stock split). However, the stock has experienced a significant decline in value since August. This decline can be attributed to the substantial dilution that resulted from the conversion of preferred shares into common stock.
This downward trend contrasts with the sustained high share price levels that AMC enjoyed over the past two years, supported by its loyal retail shareholders, affectionately referred to as the "Apes."
The technical indicators reveal significant selling pressure on AMC shares in recent months. The 14-day Relative Strength Index (RSI) reads 29, indicating oversold conditions. In such a situation, a reversal becomes more likely if a catalyst emerges to alleviate the selling pressure and propel the shares into a bullish trend.
AMC's Business Is in the Best Shape Since the Pandemic
Paradoxically, at the same time that AMC shares have sharply declined, the company has begun reporting its best financial results since 2019 — before the COVID pandemic.
For the third quarter, AMC disclosed record-breaking revenue and EBITDA (earnings before interest, taxes, depreciation, and amortization), surpassing even pre-pandemic numbers. This success was attributed to the release of international blockbusters such as Barbie and Oppenheimer.
Despite a recorded 16% decrease in theater attendance compared to 2019, a remarkable 30% increase in per-patron spending significantly contributed to AMC's robust revenue results.
However, AMC still grapples with a substantial debt burden. The company's long-term debt stands at $4.75 billion, and its current ratio (total assets divided by total liabilities) is 0.46, raising some concerns.
The company's decision to raise equity to address this issue has been well-received. With the recent sale of $350 million worth of shares, AMC is poised to raise approximately $700 million this year. This infusion of capital will help strengthen its liquidity position, facilitate debt write-offs, and alleviate any short-term survival concerns.
Price Momentum
AMC is trading near the bottom of its 52-week range and below its 200-day simple moving average.
What does this mean?
Investors have been pushing the share price lower, and the stock still appears to have downward momentum. This is a neutral sign for the stock's future value.
AMC AnalysisPrice consolidated since my last analysis. Price has recently taken the clean lows at 7.05 which I was expecting to be taken a few weeks ago. From here, I'm expecting a bullish retracement into the FVG at 9.61 next, given that we are at all time low scenario. Of course, price can still continue lower following the current order flow.

Seeing a 1:1 finishing here 'soon'This huge grind started off super misleading as the move down was very choppy. The end of this choppy move marks to me a Wave A, which was followed by a converging sideways move Wave B with an upward overshoot. The waterfall move down is an assumed Wave C which should end in and around the 1:1. Volume is peaking for the second time just like on the move up before a reversal. Let's see!

AMC Entertainment Buy TP = 9.08On the H1 chart the trend started on Nov. 13 (linear regression channel).
There is a high probability of profit taking. Possible take profit level is 9.08
But we should not forget about SL = 7.60
Using a trailing stop is also a good idea!
Please leave your feedback, your opinion. I am very interested in it. Thank you!
Good luck!
Regards, WeBelieveInTrading

AMC does this everytime it bottoms and then she runsAs you can see, AMC loves to retrace to and even below the 0.786 fib level everytime we reach a bottom and try reclaiming levels again. Then AMC pops off and usually gains some 70 to 1000% right afterwards. The share offering allows AMC to further reduce debt, which if I remember correctly could be completely wiped with only half the money due to low trading AMC-Bonds. (Remember the 007 picture AA posted referring to BOND?). This may allow AMC to finally give out a dividend which will most likely be the narrative for the next run.
I expect a touchor even a break of the 50 day sma before February 2024.
Hyped for the future of this company!

AMC | Rise out of the Shadows? | 1 buy scenarioOverview
Price is currently under the former Swinglow (lower blue line) that lead to the recent Swinghigh. With earnings and revenue date coming up (8 November) i´m looking to take a buy position.
Scenario (Orange arrow)
Requirements: Positive earnings report and price moving above the former Swinglow (blue line)
Stop- Loss: 2 Days closing under the Swinglow level (blue line)
Invalidation : Price never retakes the Swinglow level
Target: Filling of the Gap and engulf of the Short term high.
Good luck
Disclaimer:
- This information does not constitute as financial advice and is only for entertainment purposes. I am not your financial advisor.
- You trade entirely at your own risk
- Make your own research
- Finance and trading is evil, capitalism is bad, duh

$AMC straddle strategy 👁🗨️*This is not financial advice, so trade at your own risks*
*My team digs deep and finds stocks that are expected to perform well based off multiple confluences*
*Experienced traders understand the uphill battle in timing the market, so instead my team focuses mainly on risk management
Whether the market likes NYSE:AMC earnings after the bell today my team expects big price movements. According to the charts we can see that bulls need a lot more than the bears to set this thing off to $14.50.
My team is using a The Straddle options strategy leaning towards puts since bears have it easy this round. We're 25% into calls and 75% into puts. Good luck to you all!
!! This chart analysis is for reference purposes only !!
If you want to see more, please like and follow us @SimplyShowMeTheMoney

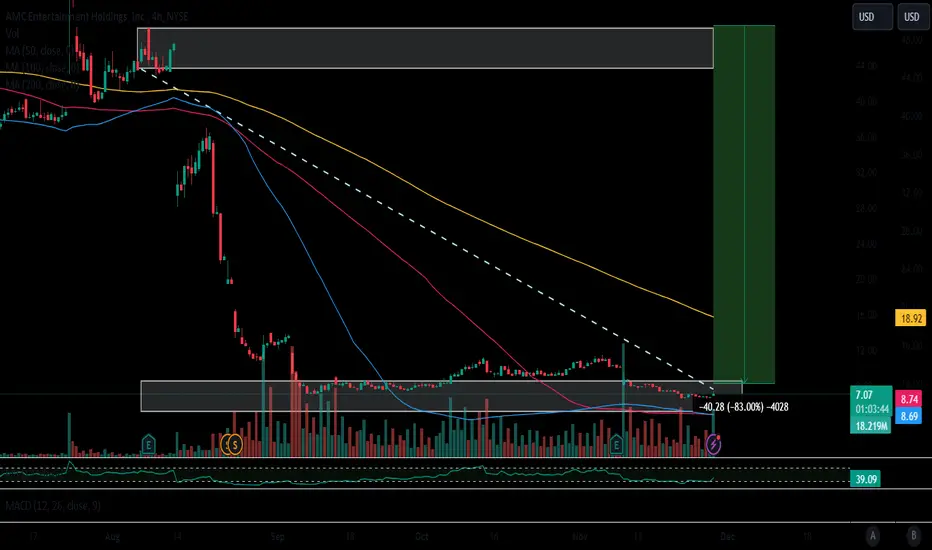
AMC Entertainment Holdings Options Ahead of EarningsIf you haven`t bought AMC before the Gamma Squeeze:
or sold before the approved combining AMC shares & APE units:
Then analyzing the options chain and the chart patterns of AMC Entertainment Holdings prior to the earnings report this week,
I would consider purchasing the 10usd strike price in the money Calls with
an expiration date of 2023-11-10,
for a premium of approximately $1.17.
If these options prove to be profitable prior to the earnings release, I would sell at least half of them. I`m still bearish for the long run. Might end up in bankruptcy after all.
Looking forward to read your opinion about it.

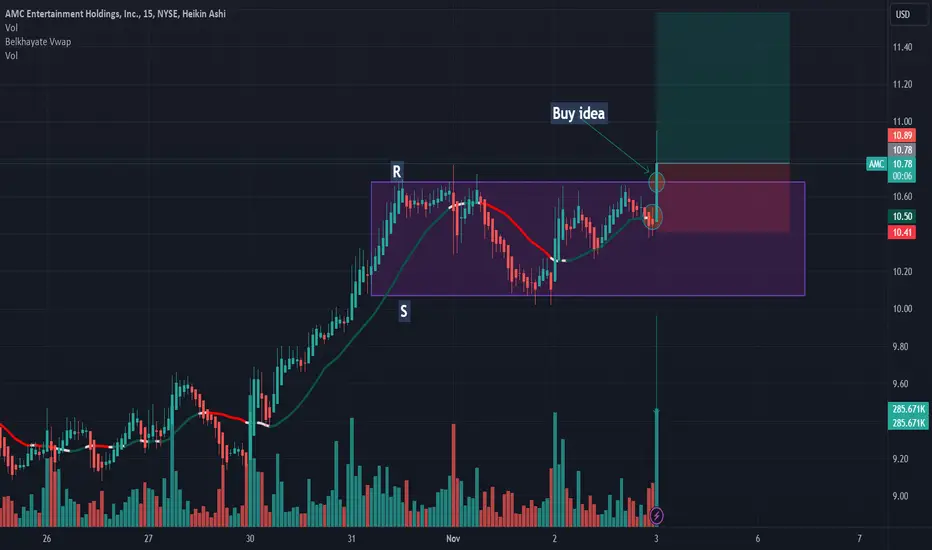
AMC: Buy ideaBuy idea on AMC as you see on the chart because we have a spring effect on vwap indicator and we have the breakout with force the resistance line by a big green candle follow by a large green volume! Thanks!
Would you look at that. Well, well, well...
Would you look at that.
Just look at it.
Have we seen this pattern before?
Our old friend, Mr. Dragon, has returned and... What's this!?
The big guy is carrying a smole bebe dragon. How cute. So maybe it's a Mrs. Dragon??
This type of dragon bottom can be v powerful with these meme stocks, definitely something worth watching. NYSE:AMC has been obliterated since the stock split, but it's smelling like reversal time and the previews have already started rolling.
AMC has been a big pumper in the past, so we could see a nice squeeze to the upside.
It's not weird to see these dragon bottoms run all the way up to the extreme 4.286 fib extension, especially with meme stocks.
Look how the 4.286 is lining up with the 200 MA (thin, squiggly, blue line). And don't forget to mind the gap up there (gold circle). It should get filled in time.
And if you think I'm crazy, CGC did something similar just a few weeks ago.
*Mwah*. Beautiful.
Still waiting on some big, green boi energy to give more confidence to the idea, but one could buy now, set a SL below the dragon legs, and let it ride.
Grab your popcorn and enjoy the show. :)

$AMC textbook play 👁🗨️*This is not financial advice, so trade at your own risks*
*My team digs deep and finds stocks that are expected to perform well based off multiple confluences*
*Experienced traders understand the uphill battle in timing the market, so instead my team focuses mainly on risk management
!! This chart analysis is for reference purposes only !!
If you want to see more, please like and follow us @SimplyShowMeTheMoney

AMC Random WalkNYSE:AMC monte carlo simulation with accompanying support and resistance channels.
Looking potentially bullish with a SL at VWAP anchored at the APE Unit Merge / RS candle.
