AMZN HEADING INTO MAY 25;FAKE OUT, OR BREAK OUT?
Definitive down trend confirmation since topping in late JAN and then a hard rejection and move down in MID FEB.
I believe we have a bottom in early April and are beginning to set a new trend up, but could be a fake breakout and continuation of Down trend.
PREVIOUS NOTE (LISTED ON CHART from MID FEB)
RED HORIZONTAL LINE
"2021 resistance HEAVY. Now could be HEAVY support?
Down trend continues on close below red horizontal line.
Keep going to re-test rectangle.
Double confirmation above higher down trend line signals reversal to retest $218.50 up at"
New potential channel has it trying to break above that red line and rejecting slightly..
rebound this week and close above red horizontal??
OR
Head down to $171-172.50 range to test bottom of potential new channel.
For now.. WAITING to see what this week brings
Checking for next week right before fed meeting, trade deals being announced etc. Big impact on Amazon
NUETRAL.
Would love to hear thoughts.
DISCLAIMER:
This is not for TRADING
This is specifically for DCA in @ solid buy levels building portfolio over time long term.
Last purchase @ $165.50 on dip.
Looking for next entry.
AMZ trade ideas

TWAP and Chaikin's Osc vs VWAP Orders and VWAP IndicatorThere are two primary Order Types that the Professional Side of the market use.
1. Time Weighted at Average Price, aka TWAP , is used extensively by the Dark Pool Buy Side, Derivative Developers, and Sell Side Banks of record for Buybacks for corporations.
The TWAP can be set at a penny to few pennies spread and pings and transacts on a specific TIME to PRICE. It can be set to time intervals shorter or longer. This is why the stock market is called "fully automated".
TWAP is used most of the time. It is rare for the Giant Institutions to use VWAP orders due to the May 2010 FLASH CRASH when a fundamental trader of e-minis accidentally hit the VWAP order type rather than the TWAP order type which caused a massive collapse of all stocks as VWAPs accelerate selling as volume increases.
2. Volume Weighted at Price or VWAP is ALSO an ORDER TYPE. It is primarily used by Small Funds Managers and Small Asset Managers who are independents trading their customers' investment money actively, often intraday. Volume Weighted at price ORDER TYPES are also automated and ping to trigger the order to transact as volume increases.
This is an easy, simple way for a busy small fund manager to cope with the complexity of buying and selling stocks with 10,000 share lots to 100,000 share lots. These are the NEW "whales" of the market.
Professional Traders Swing trade 1 million to 5 million or higher share-lot sizes. The size of the orders of the professional trader has increased significantly in the past decade.
All of you need to be aware of the market participants on the professional side as they control 80% of the 1 trillion dollars that exchange hands daily on the US Markets.
Using Chaikin's Oscillator is ideal for tracking the Dark Pool Buy Side who create the bottoms. This excellent indicator analyzes all 3 data sets: price, volume and time. Thus, it can signal early that the Dark Pools have slowly started to accumulate over time and the runs down will turn into a bottom and then pro traders will nudge price to inspire VWAP orders from the Smaller funds managers.
The VWAP INDICATOR is excellent for tracking the smaller funds managers' trading activity and it ALSO has price, volume, and time in the formula. So this is great for those of you who need an indicator for following smaller funds activity as these smaller funds VWAP orders trigger more and more volume and then runs that can move up or down for several days.
TradingView has an awesome group of indicators to use. You should customize your indicators to which market participant groups you wish to track so that you can be ready and in a position before the big runs up or down.
Trade Wisely,
Martha Stokes CMT

AMZN Weekly EntriesI am looking how to either delete a public publish or if I can just update it weekly


AMAZONAmazon has a great potential to head up towards 230 level.
Disclosure: We are part of Trade Nation's Influencer program and receive a monthly fee for using their TradingView charts in our analysis.

Volume Predicting Reversal. Trend line is established by second volume bar being within 45 degrees above or below previous bar high. The trend line is broken up first bar that forms at a greater than 45 degree angle (up or below) than last volume bar in trend.
One can confirm trend reversal by looking at candles that correspond to volume bars that indicate a trend reversal (greater than 45 degree angle from previous volume bar).

Amazon look interestingAmazon has a short target price around 202 then may have drop to be around 180 (240 min cycle). However, this dropping looks interesting for targeting long term price, which may up to 233 (2-3 months). By the way the above price may disappear if the price drop less than 165.
The strategy is waiting for buying after dropping from testing a resistant at 202$.
More important, it should be bought after it has a reversal candle.

AMAZON Buy IDEAAmazon has entered buy zone
New Higher highs are being painted
Previous support has sustained
Over all TRUMP s U turn on terrifs has paved way for recovery of Us companies.

What Amazon’s Chart Says Ahead of Next Week’s Earnings ReportAmazon NASDAQ:AMZN has been reducing its exposure to U.S. tariffs on Chinese imports recently, and is also possibly slowing down its AI-related infrastructure purchases as the online-retail giant prepares to report Q1 earnings next week. What does fundamental and technical analysis say could happen next for the stock?
Let’s check it out:
Amazon’s Fundamental Analysis
AMZN plans to release its earnings after the bell next Thursday (May 1) in the middle of an interesting period for the company.
Published reports recently indicated that Amazon has been canceling orders from some Chinese vendors in a bid to avoid the Trump administration’s new 145% tariffs on the Asian nation’s goods.
After all, Amazon would be the "importer of record" for items purchased at the wholesale level, and that’s who actually gets Uncle Sam’s tariff bills.
Of course, the tariff situation remains murky, as the Trump administration appeared this week to seek a de-escalation of its trade wars with China and other countries.
Meanwhile, Wells Fargo this week released a research note implying that Amazon could possibly become the second hyper-scaler to slow down on AI-related infrastructure purchases.
The report posited that AMZN has put some leasing discussions for the co-location of its data centers on hold. If true, that would make Amazon the second hyper-scaler to ease AI-focused capital-expenditure spending, following the lead of its key cloud competitor Microsoft NASDAQ:MSFT .
However, TD Cowen published its own research note on Monday that offered a potentially different explanation of what's going on at Amazon.
Cowen agreed that AMZN has been walking away from some co-location deals, but argued that the change stems from Amazon shifting to a preference for operating its data centers on company-owned properties.
Cowen noted that Amazon “continues to move ahead with powered shells and self-builds." The firm also pointed out that other major hyper-scalers Meta Platforms NASDAQ:META , Alphabet NASDAQ:GOOG NASDAQ:GOOGL and Oracle NYSE:ORCL haven’t shown any signs of slowing down their collective appetite for securing increased capacity through co-location.
In fact, Amazon CEO Andy Jassy recently wrote in his annual letter to shareholders that generative AI “is going to reinvent virtually every customer experience we know and enable altogether new ones about which we've only fantasized.”
He also said that’s why Amazon’s Amazon Web Services cloud business is “quickly developing the key primitives (or building blocks) for AI development.”
Jassy said those efforts includes such things as “custom silicon AI chips in Amazon Trainium to provide better price-performance on training and inference, highly flexible model-building and inference services in Amazon SageMaker and Amazon Bedrock, our own frontier models in Amazon Nova to provide lower cost and latency for customers’ applications and agent creation and management capabilities."
Hmm, does that sound like a CEO who’s cutting back on AI investment? Not to me.
Jassy did say that chips or GPUs are the reason why Amazon’s AI investments are so expensive, but added that those costs should be headed lower in the future.
Why? Because the firm's own Trainium2 chips offer performance that is 30% to 40% better in some ways than what the firm is purchasing from exterior providers.
That might not be so great for Nvidia NASDAQ:NVDA , but it doesn't sound like a problem for Amazon.
All in, the Street is looking for Amazon to report about $1.36 of Q1 GAAP earnings per share on roughly $155 billion of revenue.
That would represent a 38.8% EPS gain compared to the company’s year-ago results of $0.98, as well as more than 8% y/y growth in revenues.
While many investors would view such year-on-year growth as reflecting a solid quarter, that would also mark a deceleration of growth rates for Amazon. After all, the company hasn’t seen less than 8.5% y/y sales growth for any single quarter since Q2 2022.
I also don't know if Amazon will issue any forward guidance given our current environment of unclear tariff policies.
Amazon’s Technical Analysis
Now let’s check out AMZN’s chart going back some seven months:
Readers will first see a sloppy-looking “head-and-shoulders” pattern that formed over recent months, marked with purple boxes above. That appeared to point to a bearish reversal.
In fact, that’s exactly what happened to Amazon, leading to a sell-off that bottomed out in early April at close to $161.
But interestingly, this pattern seems to have since morphed into a potentially bullish small “double-bottom” pattern (the black diagonal lines at right) that shows a $191 pivot at its conclusion. (AMZN was trading at $186.92 Friday morning.)
Amazon also appears to have suffered a so-called "death cross" in recent days without being adversely impacted.
A “death cross” occurs when a stock’s 50-day Simple Moving average (or “SMA,” marked with a blue line above) crosses below its 200-day SMA (marked with a red line above). This is historically a bearish signal -- but anecdotally, I’ve noticed that to be true less and less often with stocks of late.
Meanwhile, readers will notice that Amazon’s Relative Strength Index (the gray line at the chart’s top) is neutral, although rising.
Separately, the stock’s daily Moving Average Convergence Divergence indicator (or “MACD,” marked with gold and black lines and blue bars at the chart’s bottom) is postured rather bullishly.
True, Amazon’s 12-day Exponential Moving Average (or “EMA,” marked with a black line) and 26-day EMA (the gold line) are both below zero. That’s historically a bearish signal.
But on the positive side, that 12-day line is above the 26-day line, which is typically bullish. The histogram of Amazon’s 9-day EMA (the blue bars above) has also moved above the zero bound, which is also often a bullish sign.
(Moomoo Technologies Inc. Markets Commentator Stephen “Sarge” Guilfoyle had no position in AMZN at the time of writing this column.)
This article discusses technical analysis, other approaches, including fundamental analysis, may offer very different views. The examples provided are for illustrative purposes only and are not intended to be reflective of the results you can expect to achieve. Specific security charts used are for illustrative purposes only and are not a recommendation, offer to sell, or a solicitation of an offer to buy any security. Past investment performance does not indicate or guarantee future success. Returns will vary, and all investments carry risks, including loss of principal. This content is also not a research report and is not intended to serve as the basis for any investment decision. The information contained in this article does not purport to be a complete description of the securities, markets, or developments referred to in this material. Moomoo and its affiliates make no representation or warranty as to the article's adequacy, completeness, accuracy or timeliness for any particular purpose of the above content. Furthermore, there is no guarantee that any statements, estimates, price targets, opinions or forecasts provided herein will prove to be correct.
Moomoo is a financial information and trading app offered by Moomoo Technologies Inc. In the U.S., investment products and services on Moomoo are offered by Moomoo Financial Inc., Member FINRA/SIPC.
TradingView is an independent third party not affiliated with Moomoo Financial Inc., Moomoo Technologies Inc., or its affiliates. Moomoo Financial Inc. and its affiliates do not endorse, represent or warrant the completeness and accuracy of the data and information available on the TradingView platform and are not responsible for any services provided by the third-party platform.

Amazon Wave Analysis – 24 April 2025
- Amazon reversed from support zone
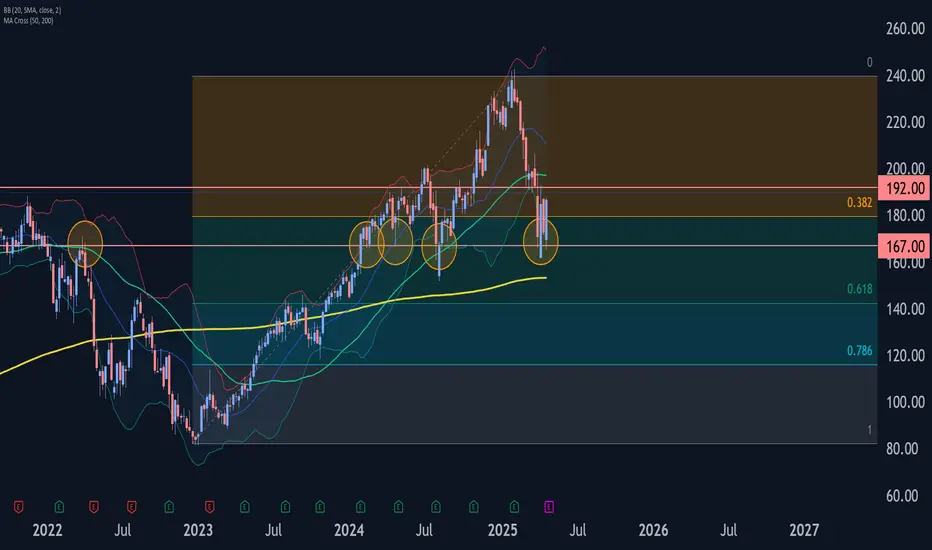
- Likely to rise to resistance level 192.00
Amazon recently reversed up sharply from the powerful support zone between strong support level 167.00 (which has been reversing the price from the start of 2024), lower weekly Bollinger Band and the 50% Fibonacci correction of the uptrend from 2022.
The price is currently forming the second consecutive weekly Japanese candlesticks reversal pattern Bullish Engulfing.
Given the clear weekly uptrend and the oversold weekly Stochastic, Amazon can be expected to rise toward the next resistance level 192.00.
AMZN - Melt up & Crash series [5 - Final]I believe the path is extremely clear now.
Top around end of June
This will be my final prediction given the new price points
Not financial advice

AMZN Option Trading + TA Outlook – April 23, 2025
📊 GEX Option Sentiment
Amazon (AMZN) is pushing into a key gamma resistance zone, testing 180–185 — where the highest positive NET GEX and stacked call walls are sitting. These zones often act as friction areas where dealers may hedge more aggressively, slowing upside or even causing a fade. Support is reinforced near 165–167 by the HVL and PUT wall.
* Key Resistance: 180 / 185 → Top of call wall stack
* Support Zone: 165.29 → HVL and highest PUT support
* IVR/IVX: IVR 59.9, IVX avg 53.8 → Elevated, with room for continuation
* Options Flow: Bullish skew with only 6.1% in puts → Dealers tilted long
* Bias: Bullish, but approaching resistance = expect stall/fade or measured breakout
🎯 Option Play Idea
If price consolidates above 180, consider 185C or 190C lottos with tight stop below 176 (gamma slip zone).
If rejected below 180 with weakness, consider a put vertical 180/170 for premium capture into support.
📈 Price Action + SMC Structure
Trend structure has turned bullish after reclaiming structure with BOS and higher lows. Current rally is testing the supply zone and previous CHoCH area around 179–180. SMC bias is green across timeframes with strong DMI and RSI confirmation.
* Market Structure: Bullish Hold, but in premium zone — we’re near resistance
* Entry Confirmation: Price must hold above 175.93
* Targets:
* T1: 187.7
* T2: 195.58
* Invalidation: Break below 173.32
* Volume Watch: Thin volume in trend → Watch for strength continuation or stall
💡 My Thoughts
This is a high-conviction continuation setup — but it’s happening directly below a heavy gamma wall and supply zone. That means timing and confirmation are everything. I wouldn’t chase the move blindly here — instead, wait for a clear breakout and retest of 180 or a pullback to 175 for a safer entry.
We’re likely to see volatility increase into earnings and dealer hedging shift fast — especially with IV already climbing. Be tactical, and don't overstay the move.
This analysis is for educational purposes only and does not constitute financial advice. Always do your own due diligence and manage risk accordingly.

Amazon longFundamental picture:
- Current price 173 with P/E 31 (10Y low)
- Implied price 405 with average P/E 80
- Expert price 267 (TipRanks)
Technical picture:
- Near Fibonacci extension limit of VWAP 200D
- Near ATR Yearly Limit
- Near 20Y Channel since 2001
Entry:
- 170
- 150
- 130
Target:
- 200
- 300
- 400
- 700
Stop:
- < 130 = PoC 2Y

How my first trade paper trading went Based on the hr chat. It did not have a breakout as yet but it had a buy signal.
It was in an uptrend according to the lower timeframes like 5m, 15m, etc.
I still entered the trade around 9:50am and made a profit around 11:50am.
Around 1pm the trade reversed and I’m not at a loss.
Maybe I should have gotten out earlier.
What I did also was went a few rows down from last and entered a call with the most open int

Amazon (AMZN): Long-Term Opportunity or Short-Term Risk?
-Key Insights: Amazon faces headwinds from bearish market sentiment, trade
issues, and cloud service competition. Near-term challenges stem from tariffs
impacting goods sold on its platform and slowing momentum in Amazon Web
Services. The upcoming earnings report may provide clarity on its resilience.
Valuation metrics suggest potential upside, but caution is advised.
-Price Targets: Next week price levels suggest possible long entry points near
support zones.
- Target 1 (T1): $180
- Target 2 (T2): $185
- Stop Level 1 (S1): $170
- Stop Level 2 (S2): $167
-Recent Performance: Amazon has recently underperformed, trading 1% lower amid
overall large-cap tech weakness. Broader market struggles, particularly in the
Nasdaq index, reflect bearish sentiment affecting growth-focused sectors. Trade
tensions and increased competition in cloud services are significant factors
weighing on its performance.
-Expert Analysis: Analysts highlight Amazon’s vulnerability to tariffs, which
could squeeze margins and affect merchants relying on imported goods from China.
AWS growth faces slowing dynamics as Google Cloud and Microsoft Azure gain
ground. While some experts argue Amazon’s valuation is becoming attractive with
a P/E ratio near 30, its risks warrant cautious optimism ahead of earnings.
-News Impact: The upcoming earnings report will be pivotal for assessing
Amazon’s adaptability to macroeconomic pressures. Tariff-related disruptions
could reveal more pain points in its retail segment. Simultaneously, competition
in cloud services and shifts in consumer demand may paint a clearer picture of
long-term growth potential. Competitive pressures from Google Cloud, which grew
30% year-over-year, indicate AWS’s dominance is under threat.

AMZN Bulls Crab After a period of seller dominance, indicated by the exhaustion of previous pricing strategies and the "crab" reaching its limit, the market dynamic has shifted.
The impetus now lies with the buyers, as their own strategic maneuvering and pricing pressure ("crab") begins to exert influence on the negotiation process and overall market direction.
This transition suggests a potential re-evaluation of asset value and a possible consolidation of buyer power.

Amazon losing weekly trendline – watch these Fibo levels nextTechnical Analysis
Amazon (AMZN) has broken below its weekly ascending trendline and failed to reclaim the key 0.618 Fibonacci level (180.52). Strong bearish volume and a weakening RSI suggest downside continuation. Key support targets lie at 161.55, 151.21, and 142.58, with extended downside to 119.12.
Fundamentals
Macro pressure from high interest rates and a slowdown in consumer spending weighs on Amazon. Intense competition in AWS and e-commerce adds uncertainty. Upcoming earnings may serve as a catalyst for directional clarity.
Scenarios:
Base case – move down toward 151.21, 142.58, 119.12
Bullish case – break above 180.52 → rally toward 207.52, 241.92

AMZN Weekly Options Trade Plan 2025-04-16AMZN Weekly Analysis Summary (2025-04-16)
Below is a synthesis of all the reports and our resulting view:
──────────────────────────────────────────────
Comprehensive Summary of Each Model’s Key Points
• Grok/xAI Report – Viewed AMZN’s charts as showing a short‐term bearish bias even as some technicals (daily MACD) hint at a possible rebound. – Noted price near key supports and high put open interest. – Recommended a bearish single‐leg play: buying the $172.50 put at a premium of $0.85 (despite that premium being a bit high relative to our “ideal” range).
• Claude/Anthropic Report – Highlighted that on shorter timeframes (and with max pain at $185), some momentum and oversold conditions might create a bounce. – Emphasized bullish short‐term potential, recommending a trade on the $180 call at a premium of $0.71.
• Gemini/Google Report – Interpreted the technicals (EMAs, RSI, Bollinger Bands) as strongly bearish, with price testing a critical support level near $176. – With the options chain showing significant put volume at lower strikes, they recommended buying the $170 put (ask roughly $0.46) for its leverage and within or close to the target premium range.
• Llama/Meta Report – Also examined the multiple technical indicators and noted the mixed signals. – Although they observed bearish factors, their conclusion was cautious enough to state “NO TRADE RECOMMENDATION TODAY” if conditions aren’t optimal.
• DeepSeek Report – Concurred with the bearish outlook on both intraday and daily levels. – Recommended a trade on the $170 put (premium $0.46) with clear risk management (stop out if AMZN rallies above approximately $177.50).
────────────────────────────────────────────── 2. Areas of Agreement and Disagreement Between Models
• Agreements – Most models agree that AMZN is trading below key short‐term and longer-term EMAs, with technical momentum looking bearish. – There is a consistent theme in the options data of high put open interest and strong volume in strikes below the current price. – Several reports (Grok/xAI, Gemini/Google, DeepSeek) favor a bearish put trade based on support levels and risk/reward dynamics.
• Disagreements – The Anthropic analysis offered a moderately bullish case (with a call trade) based on oversold short‐term conditions and a max pain level high above current price. – Llama/Meta expressed enough caution so that if price action does not break expected levels, the trade might be skipped entirely. – The recommended strike/premium differs: Grok/xAI’s $172.50 put is slightly closer to the money with a higher premium, while Gemini/DeepSeek prefer the leaner $170 put (solid liquidity, premium ~ $0.46 in our target range).
────────────────────────────────────────────── 3. Clear Conclusion
Overall Market Direction Consensus: The majority of the reports lean toward a moderately bearish outlook given that AMZN’s current price is below key EMAs, near immediate support levels, and is trading in a high-volatility environment. Although there’s one bullish view (and some caution from Llama/Meta), the bearish technicals and put-side open interest weigh more heavily for a weekly option play.
Recommended Trade (if conditions are met at open): • Trade: Buy a single-leg, naked put option. • Strike: $170.00 • Expiration: April 17, 2025 • Premium: Approximately $0.46 per contract (which sits nicely near our ideal range of $0.30–$0.60) • Entry Timing: Begin at market open based on confirmed weakness below support levels • Profit Target: Approximately a 100% gain on the premium (aiming for roughly $0.90) • Stop Loss: About $0.35 (or exit if AMZN rallies decisively above roughly $177.50) • Trade Confidence: Around 65% given the technical bearish bias and clear liquidity, though mindful of the risk that a short-term bounce at support could reverse the trade.
Key Risks and Considerations: • A sudden short-term recovery (bouncing off support around $176) could trigger losses. • High volatility (indicated by the VIX) means that intraday whipsaws remain possible. • The mixed viewpoints (especially the bullish call suggestion) underscore that any entry must respect tight stop-loss discipline. • News and broader sector conditions could alter momentum unexpectedly.
────────────────────────────────────────────── 4. TRADE_DETAILS (JSON Format) { "instrument": "AMZN", "direction": "put", "strike": 170.0, "expiry": "2025-04-17", "confidence": 0.65, "profit_target": 0.90, "stop_loss": 0.35, "size": 1, "entry_price": 0.46, "entry_timing": "open" }
Disclaimer: This newsletter is not trading or investment advice but for general informational purposes only. This newsletter represents my personal opinions based on proprietary research which I am sharing publicly as my personal blog. Futures, stocks, and options trading of any kind involves a lot of risk. No guarantee of any profit whatsoever is made. In fact, you may lose everything you have. So be very careful. I guarantee no profit whatsoever, You assume the entire cost and risk of any trading or investing activities you choose to undertake. You are solely responsible for making your own investment decisions. Owners/authors of this newsletter, its representatives, its principals, its moderators, and its members, are NOT registered as securities broker-dealers or investment advisors either with the U.S. Securities and Exchange Commission, CFTC, or with any other securities/regulatory authority. Consult with a registered investment advisor, broker-dealer, and/or financial advisor. By reading and using this newsletter or any of my publications, you are agreeing to these terms. Any screenshots used here are courtesy of TradingView. I am just an end user with no affiliations with them. Information and quotes shared in this blog can be 100% wrong. Markets are risky and can go to 0 at any time. Furthermore, you will not share or copy any content in this blog as it is the authors' IP. By reading this blog, you accept these terms of conditions and acknowledge I am sharing this blog as my personal trading journal, nothing more.

Amazon.com, Inc. (AMZN) – Short-Term Bullish OutlookTechnical Analysis
From the monthly chart, Amazon (AMZN) has demonstrated strong price structure within two clearly defined bullish channels:
Bullish Channel 1 (2018–2021): This marked a significant uptrend phase, culminating in an extended consolidation and pullback.
Bullish Channel 2 (2023–2025): After a period of correction that bottomed near a “Weak Support Region” (~$80–$100), AMZN entered another strong upward trajectory.
Most recently, AMZN broke below the current bullish channel, retesting the critical horizontal support zone around $186.93. This red zone represents a key breakout-retest area, suggesting a short-term accumulation phase.
Entry Zone: ~$172–$180
Target: $258.58 (Upside of ~38.34%)
Stop-Loss: $151.76 (Downside risk ~18.81%)
The risk-to-reward ratio of 2:1 supports a high-conviction bullish trade setup. Should price hold above the $172 area and regain momentum, we may see a continuation toward the upper price targets.
Fundamental Analysis
Amazon’s fundamentals remain robust, providing a solid foundation for the bullish technical thesis:
Strong Operating Margins: AMZN boasts a high EBITDA/Sales ratio, signaling efficient operations and solid cash flow generation.
Financial Strength: The company is financially sound, with low debt levels and strong investment capacity—critical for maintaining leadership in tech and logistics.
Positive Analyst Sentiment: The stock enjoys favorable analyst coverage, with an average consensus to buy or overweight. Recent upward revisions in EPS estimates reinforce expectations of earnings strength.
Valuation Gap: There’s a significant upside gap between the current market price and the average analyst target, reflecting potential for re-rating as growth accelerates.
Consistent Outperformance: Historically, Amazon tends to beat earnings expectations, showcasing its operational consistency and innovation-led edge.
ESG Rating: MSCI scores Amazon positively on ESG for its industry, which can attract long-term institutional interest.
Amazon is currently in a key technical zone where fundamental strength meets technical opportunity. Your chart shows a well-placed entry aligned with structural support, and the company's solid balance sheet, rising analyst expectations, and earnings history all add fuel to the bullish outlook.
If current support holds, the technical and fundamental setup favors a short- to medium-term rally, targeting levels beyond $250, while maintaining a controlled downside.

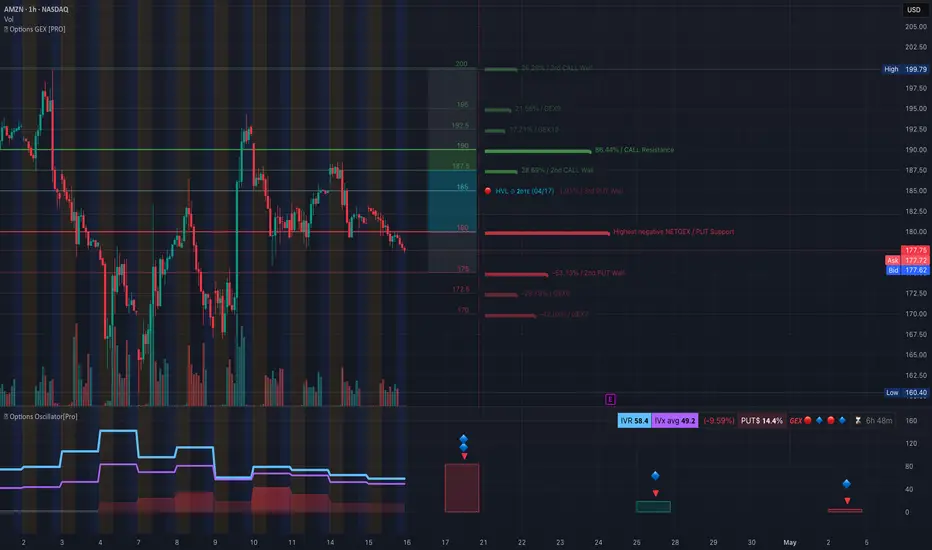
AMZN GEX Breakdown: Gamma Cliff Below! It's on Edge into Earning🔮 GEX (Gamma Exposure) – Options Flow Analysis
🚩 Heavy PUT Pressure at 179–175
* AMZN is trading just above its highest negative GEX zone at 179.30, which marks the top of a dense PUT support zone.
* A breakdown below 179 may trigger aggressive dealer hedging and push price swiftly to 175, then 172.5 where second PUT Wall is located.
* Further support sits around 170, with a deeper PUT wall at 166.94.
📈 Resistance Cluster at 185–190
* Above price, multiple CALL resistance levels stack tightly from 185 → 187.5 → 190.
* The 86.44% CALL Resistance at 190 marks the gamma ceiling — dealers are short CALLs and likely to hedge against rallies here, making upside stickiness high.
📊 GEX Sentiment Summary:
* IVR: 58.4 → Volatility is elevated, traders are hedging more aggressively.
* IVx: 49.2, down –9.59%, shows softening vol despite rising risk — hinting a potential vol crush if breakdowns continue.
* PUTs only 14.4%, but concentrated around current price levels — enough to trigger sharp gamma-driven moves on breakdowns.
🎯 GEX Implications:
* Bearish trigger if AMZN loses 179 — opens room to 175, 172.5, possibly 170–166.9.
* Bullish bounce only holds if 179 defends and price reclaims 183+, but faces strong CALL resistance near 190.
🕰️ Technical Analysis – 1 Hour Chart
Trend Analysis:
* AMZN broke below both VWAP and rising support line, confirming bearish short-term trend.
* Price is compressing inside a descending triangle, now threatening a full breakdown.
Indicators:
* MACD: Bearish crossover is holding, with no bullish momentum yet.
* RSI: Falling under 40, no divergence forming — confirms sellers still in control.
Key Zones to Watch:
* Support: 179 → 175 → 172.5 → 170 → 166.94
* Resistance: 183.5 → 185 → 188.42 → 190
🧠 Final Thoughts:
AMZN is perched right above a gamma cliff, with GEX showing dominant PUT support that could flip into downside acceleration on any weakness under 179. CALL resistance above is dense and unrelenting, especially ahead of earnings.
Bulls need a sharp reclaim of 183+ to neutralize risk — otherwise, this chart favors continuation lower into the mid-170s.
This analysis is for educational purposes only and does not constitute financial advice. Always trade with proper risk management and let price confirm your bias.
AMAZON is on its 3rd historic +1000% growth Bull Cycle.Amazon (AMZN) almost has been trading within a multi-year Channel Up pattern since the Housing Bubble bottom in November 2008 and this month almost touched its 1M MA50 (blue trend-line).
With the exception of the 2008 Housing Crisis and the 2022 Inflation Crisis, which bottomed on the 1M MA100 (green trend-line), the 1M MA50 has never been broken. In fact it has been the key Support of every Bull Cycle that surprisingly has so far peaked on a +1051% rise.
As you can actually see by the 1M RSI, such corrections, like the one in the past 3 months, are quite common within the Channel Up and offer excellent long-term buy entries.
So, technically the Inflation Crisis bottom (December 2022) on the 1M MA100 has initiated Amazon's 3rd historic Bull Cycle within this pattern and based on the previous two, it may also peak after a +1051% rally inside 2028. Our projected Target on this is $900.
Would you miss out on such an opportunity in the past?
-------------------------------------------------------------------------------
** Please LIKE 👍, FOLLOW ✅, SHARE 🙌 and COMMENT ✍ if you enjoy this idea! Also share your ideas and charts in the comments section below! This is best way to keep it relevant, support us, keep the content here free and allow the idea to reach as many people as possible. **
-------------------------------------------------------------------------------
💸💸💸💸💸💸
👇 👇 👇 👇 👇 👇

AMZN in Correction wave 2025Here is Elliott wave. AMZN in correction wave A-B-C.
Price target $201.20 (B).
Down across strong support then retest at $188.11.
Finish Elliott wave around $145.86 (C), around 08.25.25.
Now, AMZN price $182.12 (04.14.2025).
IMO amateur trader.
Good luck!

Amazon (AMZN): Eyeing a Long Opportunity Amid AI Growth Potentia-Key Insights: Amazon demonstrates a dual opportunity for investors. Short-term
technical analysis shows a bounce toward resistance levels at $188-$200, driven
by accumulation trends in broader tech stocks. Long-term catalysts include
undervaluation, a robust cloud computing business, and aggressive AI
infrastructure expansion, solidifying Amazon as a leading contender among major
tech firms. Investors should consider long positions, leveraging the current
market narrative of stabilization and upside.
-Price Targets:
- Next Week Targets: T1=$195, T2=$200
- Stop Levels: S1=$181, S2=$175
-Recent Performance: Amazon has experienced bearish pressure with its year-to-
date performance down by 16%-33%, aligning with broader trends in major tech
stocks. Despite these declines, accumulation patterns suggest a pivot toward
bullish momentum. The stock showed resilience, touching resistance levels in the
$190-$200 range amid temporary rebounds prompted by sector-wide stabilization.
-Expert Analysis: Analysts highlight Amazon’s undervaluation and long-term
growth opportunities, reinforced by a PE ratio of 33 and a DCF model suggesting
72% upside potential. Robust AI investments, including cost-effective in-house
solutions, signal leadership in technology infrastructure while challenging
competitors like Nvidia. Diversified revenue streams from advertising, cloud
computing, and robotics further strengthen its investment appeal.
-News Impact: Tariff concerns on semiconductors could contribute to short-term
volatility but are unlikely to undermine Amazon’s strong fundamentals.
Anticipated earnings announcements may become a critical catalyst for price
movements, with broad tech recovery trends providing support. Allegations of
insider trading involving U.S. Representative Marjorie Taylor Greene shed light
on the market importance of Amazon stock, underscoring its pivotal role in
investor portfolios.
