APC trade ideas
APPLE Trading Opportunity! SELL!
My dear subscribers,
This is my opinion on the APPLE next move:
The instrument tests an important psychological level 244.56
Bias - Bearish
Technical Indicators: Supper Trend gives a precise Bearish signal, while Pivot Point HL predicts price changes and potential reversals in the market.
Target - 234.19
My Stop Loss - 250.52
About Used Indicators:
On the subsequent day, trading above the pivot point is thought to indicate ongoing bullish sentiment, while trading below the pivot point indicates bearish sentiment.
———————————
WISH YOU ALL LUCK
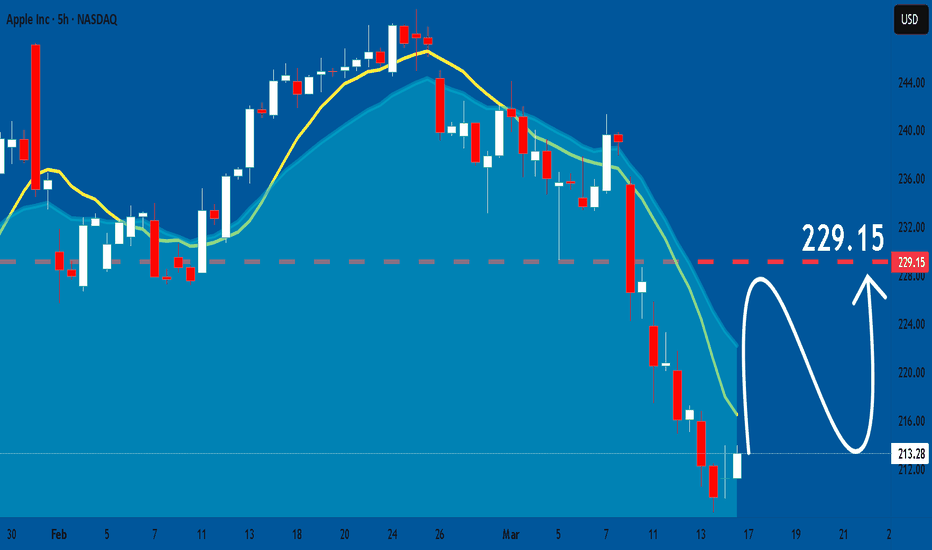
APPLE The Target Is UP! BUY!
My dear friends,
Please, find my technical outlook for APPLE below:
The instrument tests an important psychological level 213.28
Bias - Bullish
Technical Indicators: Supper Trend gives a precise Bullish signal, while Pivot Point HL predicts price changes and potential reversals in the market.
Target - 227.02
Recommended Stop Loss - 205.96
About Used Indicators:
Super-trend indicator is more useful in trending markets where there are clear uptrends and downtrends in price.
———————————
WISH YOU ALL LUCK
Apple - A is almost finishedLooking at the pattern / structure being carved out, I believe we need another slight low for this part of the pattern to be considered complete. We also have yet to hit the red 1.0 ($0.33 cents away) and are just shy of tagging the white 1.618 @ $207.76. This technically isn't required, but in my experience, far more times than not, a=c. We could always extend down to the red 1.618 @ $182.21, but I do not find that likely at this juncture. I find it far more likely we get the slight OML and then begin moving higher in minor wave B.
Should price decide it does want to extend out, the next fib lower I would want to be watching is the red 1.382 @ $192.09. The next target higher for minor B, should be in the $240-$250 range. Should it extend down to the 1.382, that will lower the target for B by about $10. Hopefully this week we can kick off minor B.
AAPL at Crucial Support! Bounce or Breakdown Ahead? Mar 17 WeekHere's a quick analysis on AAPL based on the 4-hour chart.
📈 Technical Analysis (TA):
* AAPL just touched a key demand zone around $210, forming a potential reversal area.
* A clear Break of Structure (BOS) at $210 signals this level as critical support.
* Immediate resistance is visible at $225, with a further hurdle around $229–$230.
* Watch out for a major resistance zone above at $241–$249 if bullish momentum returns.
* Descending trendline resistance currently around $225–$229 is also significant for bullish confirmations.
📊 GEX & Options Insights:
* Strong PUT support at $210 marked by highest negative NET GEX—important level for potential bounce.
* CALL resistance currently at $217.50; breaking above could lead to a gamma-driven upside move.
* High IV Rank at 66% indicating rich premiums, ideal for options sellers or premium collection strategies.
* PUT ratio at 6.5% indicates bearish sentiment dominating option flows.
💡 Trade Recommendations:
* Bullish Play: Enter cautiously on bullish confirmation above $217.50, targeting $225 initially. Tight stop below $210.
* Bearish Play: Consider puts on strong rejection at $217.50, targeting retests of $210 and possibly lower to $200.
* Neutral strategies: Selling premium through credit spreads or Iron Condors between clear range ($210–$225).
🛑 Risk Management: Ensure clear entries and disciplined stops, especially with heightened volatility.
Let's trade smart and stay safe!
Disclaimer: This analysis is for educational purposes only and does not constitute financial advice. Always do your own research and manage your risk before trading.
AAPL (Apple): Has a Large Correction Begun? More Downside Ahead?On this chart, we are currently tracking the potential beginning of a larger downtrend, which could be a larger-degree Wave 4 correction. It is possible that a larger-degree third wave topped in December 2024 at $260, and for now, I am assuming this is the case. While further confirmation is needed, the price has already broken below our first signal line, which supports the idea that a larger decline has begun—unless the next rally develops into a clear impulse structure.
At the moment, the price appears to be in the late stages of Wave C of Circle Wave A to the downside. Immediate resistance sits between $220 and $224, and only a break above $224 would indicate that Circle Wave B to the upside may have already started.
One important note: Circle Wave B could technically overshoot to the upside, meaning that if Circle Wave A completed as a three-wave pullback, we could even see a new high in the next bounce before the larger downtrend continues. This is something to keep an open mind about, as it is still early to confirm a substantial top on the long-term chart.
For now, as long as resistance at $224 holds, the assumption remains that Circle Wave A needs one more low before a stronger bounce occurs.
APPLE: Expecting Bullish Continuation! Here is Why:
Looking at the chart of APPLE right now we are seeing some interesting price action on the lower timeframes. Thus a local move up seems to be quite likely.
Disclosure: I am part of Trade Nation's Influencer program and receive a monthly fee for using their TradingView charts in my analysis.
❤️ Please, support our work with like & comment! ❤️
AAPL BULLS ARE GAINING STRENGTH|LONG
AAPL SIGNAL
Trade Direction: long
Entry Level: 213.28
Target Level: 232.17
Stop Loss: 200.88
RISK PROFILE
Risk level: medium
Suggested risk: 1%
Timeframe: 9h
Disclosure: I am part of Trade Nation's Influencer program and receive a monthly fee for using their TradingView charts in my analysis.
AAPL: Apples Are On Sale! Buying More!Technicals:
When the chart hits just right, something are left best unexplained.
Look at this month's chart's last reddish color down price bar in Apple's stock (AAPL). Do you see a collapse in it's stock? Or does it just look like it took a brief pause and giving you a chance to buy more "apples" at a discounted price. 🙂
Monthly:
Weekly:
Equal legs + 50% fib pullback + cloud support+ uHd
Daily:
ExDiv1 at equal legs
".....accelerating growth in the money supply is historically correlated with broadening stock performance. As smaller companies have easier and less expensive access to capital, they can invest more in their own growth initiatives. That leads to stronger returns investors typically expect from smaller companies in normal economic environments and more S&P 500 constituents outperforming the overall index. One of the easiest ways to invest in that trend reversal is to buy an equal-weight index fund like the Invesco S&P 500 Equal Weight ETF. The equal-weight index balances every component of the S&P 500 equally. This means the amount you'll invest in the biggest mega-cap stocks is the same as the smallest members of the index. Each quarter, the index's managers rebalance it, and new constituents are added, while others leave." (www.fool.com)
I think that is the safest bet for where to set aside and allocate your money every month towards if you don't want to worry about being a market wizard and a savant.
However, Apple and Nvidia are still good businesses to invest in.
APPLE, will we see 200$ again ?Hello traders, Hope you're doing great. What are your thoughts about NASDAQ:AAPL ?
for upcoming weeks, I expect an upward correction at first and after that I expect a SELL OFF situation in the market that causes a huge drop in stock market, my first Target is 200$.
This post will be Updated.
Trade Safe and have a great week.
Apple Wave Analysis – 13 March 2025
- Apple broke support area
- Likely to fall to support level 200.00
Apple recently broke the support area between the strong support level 220.00 (which has been reversing the price from October) and the 61.8% Fibonacci correction of upward impulse from August.
The breakout of this support area accelerated the active impulse wave 3 of the sharp downward impulse wave (C) from February.
Apple can be expected to fall to the next round support level 200.00 – which is the target price for the completion of the active impulse wave (C).
$AAPL Ready to Explode? Harmonic Pattern and OversoldAlright, folks, it looks like Apple stock has just nailed one of those harmonic patterns, and on top of that, the RSI is screaming oversold, hitting a rock-bottom 26—the lowest it’s been in a year! With the stock chilling and holding steady at these current price levels, it’s boosting the odds of a sweet upward price reversal coming our way.
AAPL short on reboundWhile I've been putting up shorts for Nasdaq, Meta, Google, and Amzn, I just realized that I did not do it for AAPL. So here's the wave counts update. While the direction is down, it does not mean to short it now because this wave 3 down is now approximately equals to wave 1 (around $40). An extension of 1.618 will give us another $24 down move but I CANNOT be certain if there would be any corrective wave up making this current wave 3 a 5-waves movement.
So my suggestion is to wait for rebound and short.
Was AAPL overextended? Short TradeIf we look at AAPL this week, it's the most bearish asset this week. But how can we confirm that there's room for APPL to trend lower. After invalidating the weekly bisi there are no PD arrays to support price higher or to hold it. Next, indices are bearish! In Daily and H4 tf, it leaves FVGs without being retraced to while indices, especially QQQ and other tech stocks retraced to these FVGs, signaling AAPL extremely bearish and could now target daily or weekly targets from previous months.
APPLE Buy opportunity on the 1W MA50.Apple Inc. (AAPL) has been trading within a 2-year Channel Up since the January 03 2023 bottom and in the past 3 months (December 26 2024) has been forming the latest Bearish Leg. On Tuesday this Leg broke below its 1W MA50 (red trend-line) for the first time in 10 months (since May 08 2024), which is the strongest buy signal since the April 19 2024 Higher Low bottom of the Channel Up.
As you can see, even the 1D RSI pattern is similar with the one that made the October 26 2023 1W MA50 test. That was also on the 0.618 Fibonacci retracement level from the respective previous Low.
As a result, it is now highly likely to see a rebound, especially if the 1W candle closes above the 1W MA50, to test the previous High and 1.0 Fib at $260, like the December 14 2023 High did.
-------------------------------------------------------------------------------
** Please LIKE 👍, FOLLOW ✅, SHARE 🙌 and COMMENT ✍ if you enjoy this idea! Also share your ideas and charts in the comments section below! This is best way to keep it relevant, support us, keep the content here free and allow the idea to reach as many people as possible. **
-------------------------------------------------------------------------------
💸💸💸💸💸💸
👇 👇 👇 👇 👇 👇


