Is $BIDU a Buy Candidate?Though today's above average volume is a concern, still price is above recent entry point $140. Watch at that level for second chance to take out recent solid wall at and around 153.5 area with target price 183 level this can take a few months to achieve. It's 30% upside move if price holds $140. www.2waytrading.com
B1C trade ideas

BIDU bearish – Posts new 14-month lows, eyes 148.16 next BIDU continues to weaken, posting new 14-month lows towards the 148.16 area (near 61.8% of the 83.27/251.99 rise). Below lies the 140.66 key support (April 7, 2014 weekly low). The 179.06 resistance should cap near-term bounces.
Outlook:
Short term: bearish
Long term: bearish

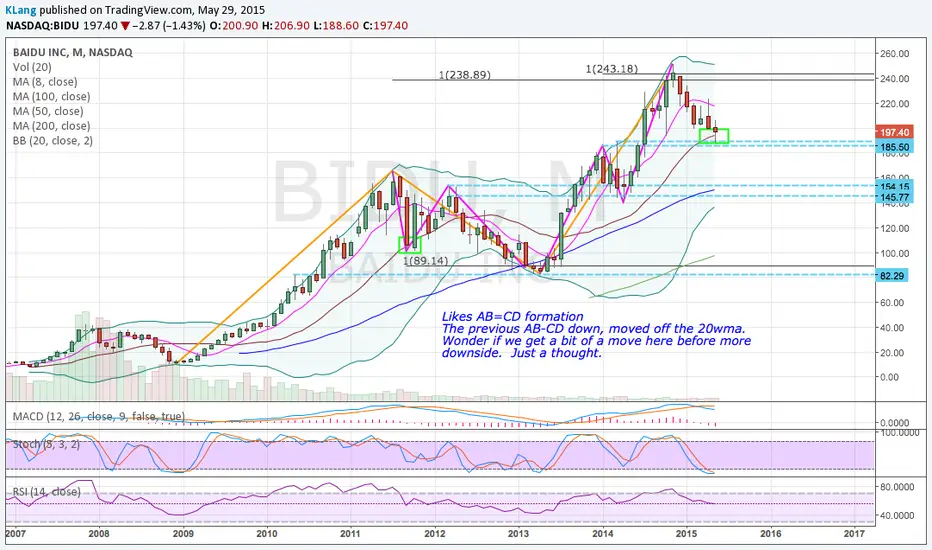
BIDU - Scary out the week hands and turn north again?Context:
monthly uptrendig intact
natural PB to lower extreme
Swings
seems that major pendulum swing has fullfilled its job, since the sinus wave looks completed
also the minor sin. wave completed
Price Action
orderly former flow to the downside
pressing - major fish in the pond wants cheaper price to fill his bag
create panic - whale create panic to collect it all from the week hands
price stops right at a center of a reaction line, and within the center box, where former accumulation was
Outlook
potential support in the range of 150/160
as sinus boxes often get washed, it's a good idea to start small and add to the position later
Trade Idea (Position Trade)
stopp needs to be below the box, plus some
start small between expected support range and build on further confirmation
profit a) at the upper MLH (P5), just little below the sliding
Trade Management
move B/E when Risk/Reward is @1.5
trail below real structure, or if price explode to the north, trail below wide range bars (see Jul. 14 and Jul. 15)

Bye, Bye, BaiduChina's stockmarket crash coupled with mixed earnings results put pressure on Baidu (BIDU). The company reported profit for the second quarter of 3.66 billion yuan ($591 million), up slightly from 3.55 billion yuan in the same quarter a year earlier. EPS stands at $1,81, which is below analysts' estimate of $1,84. Baidu's revenues rose 38 percent from a year earlier to 16.57 billion yuan, which is in line with expectations. The guidance for Q3 is below consensus.
Baidu ended the formal trading day down 4.16%. The sell-off continued in after-market trading. We expect more selling pressure to come. There's a reversal pattern on the weekly chart, and the trend is clearly down. 167 area is seen as an appropriate target.

Bears trying to make a statement hereChannel operator, touched the top, now trying to head down to the 188 level.

$BIDU H & S and downtrend$BIDU has a classic bearish H & S. It has now broken down from its trendline of the retracement (around $190 - $212) 1st target at 0.5 fib retracement hit today. Ultimately, traditional technical analysis would suggest an ultimate Price Target of close to $172. Let's wait and see. If you have any comments or queries, do get in touch... Happy Trading!

Look for high probability trades.You don't have to trade every tick.. Look for high probability trades and jump on them.


Looking to short at intra-day resistanceWell its that time of the year again to re-short reload & reshort BIDU =)
Looking to short at intra-day resistance between $195-$197 with the first target being $177 and the second target being the 2.618 Extension at Weekly support.
-Reason for short: Fundamental outlook for BIDU doesn't support current price, and the technical break of $195.40 Weekly support.
-Intra-day chart:

Buy on BreakoutBidu could run to the above levels the key is volume on todays breakout and to see if by end of day it has closed above the breakout resistance level

BIDU $205.84: Tests 9-week range low; bearish technical indicatoBIDU $205.84: Tests 9-week range low; bearish technical indicators caution for downside
BIDU has been consolidating within the 9-week 202.20-220.75 range near the 55 day moving average. Bearish technical indicators suggest there is scope for further downside. A break below the 202.20 range support would confirm a lower high at 220.75 (April 6, 2015) and extend the 5-month downtrend towards the 199.70 low (February 9, 2015) and then the 194.31 reaction low (October 13, 2014). Below rests the range target at 183.65 (220.75-202.20 measured from 202.20) and then the equality target at 168.46 (251.99-199.70 from 220.75). However, if bulls reclaim the 220.75 range resistance, that would negate the bearish momentum and stabilize for 234.67 (January 19, 2015).
Outlook:
Short term: Neutral with a bearish bias
Long term: Bullish

Baidu Challenging ResistanceBaidu is testing a major confluence, watch for a long trade if it breaks
Main falling channel resistance
Major 200-days Simple moving average
Horizontal resistance and previous swing highs
A break above that resistance(220) with daily closing confirms 235 and 250 as next main targets.
Good luck...
thefxchannel.com , visit.. vote and subscribe. Thank you
twitter.com
My best regards
Technician

BIDU $217.22: Potential double bottom within a 4-1/2 month falliBIDU rallied off the 202.20 low (March18, 2015, above the 199.70 spike low (February 13, 2015)) back above the 200 day moving average (currently at 209.24) to test the 217.85 5-week range high (March 6, 2015). Bullish MACD suggests further upside remains favored. Clearing the latter would confirm a double bottom at 202.20 (as shown on the daily chart) and trigger further gains towards the 221.52 area (January 30, 2015 range high) near the 4-1/2 month falling channel resistance. Above would bolster for 233.50 (double bottom target 202.20-217.85 from 218.75) near 234.67 lower high (January 26, 2015). Immediate support levels are 211.50 (March 23, 2015 reversal low) and then the 200 day moving average.


$BIDU is now 212.13. Price Target Hit. Great HPS Trade.$BIDU is now 212.13. Price Target Hit. Great HPS (High Probability Setup) Trade.


Baidu Bounce to $240Short term bounce setting up. RSI and stochastics are almost oversold and there is some bullish divergence when looking at the MACD. Also 200 EMA is just below the current price along with support that has been in play for a while. Currently trading right on the 0.382 fib retracement. Anything could happen but it looks like BIDU is setting up

BIDUSomebody wanted 233.00 to get tagged pretty badly. That triggered shorts along the way. Now they get squeezed.


