CAT break and retestCAT is looking strong. Came back to test key support level and had a flawless bounce. Next leg up, $228 next target.
CAT1 trade ideas


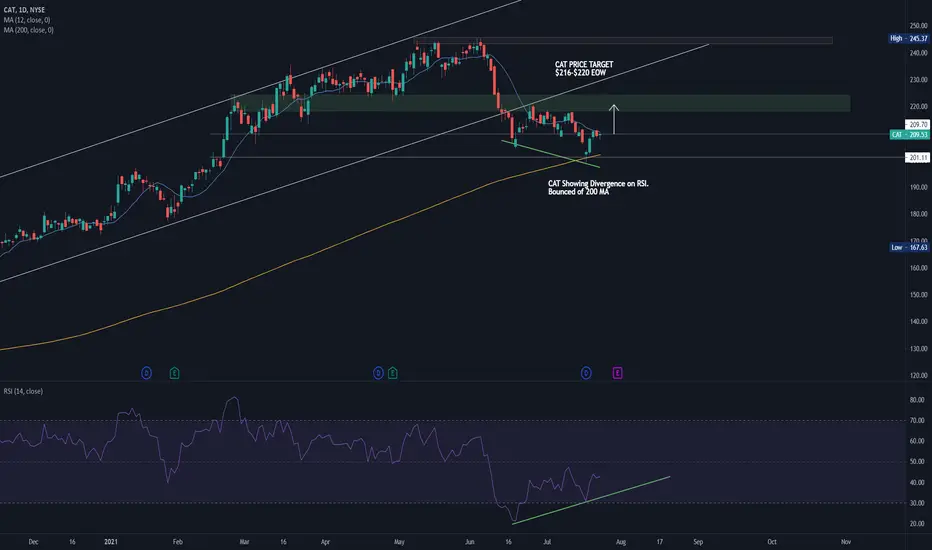
CAT looking like its ready to run this week.CAT chart is looking bullish. Nice bounce of 200 MA, RSI and price action are showing bullish divergence. Might wait for 12 MA to cross 26 MA before entering long. PT $216-$220 by EOW if earnings don't miss.
$CAT with a Neutral outlook following its earnings #Stocks The PEAD projected a Neutral outlook for $CAT after a Negative Under reaction following its earnings release placing the stock in drift D with an expected accuracy of 66%.
If you would like to see the Drift for another stock please message us. Also click on the Like Button if this was useful and follow us or join us.

CAT - reversalCAT is reversing on volume together with industruals and DOW index
can easily go to the next resistance, 230-240


CAT BreakoutNYSE:CAT breaking out from a bottoming triangle/200SMA wedge
looking to target $220/$222

TrendyTrades: CAT BullishCAT is setting up for a big move up this downtrend acting as signal. Watch for a break of the downtrend for an entry long.

$CAT - Double bottom with RSI divergence daily$CAT - Double bottom with RSI divergence daily, with Infra bill as catalyst watch for break out

Still Bullish on CAT(Update)I think it is a great time to purchase CAT. CAT has retraced to the 0.38 Fib support and has held that support for a pretty good amount of time. Due to this extended period of low volatility, we can assume that a big play is about to occur. I also observed that the squeeze indicator for the weekly is signifying that of low volatility(grey crosses) which adds onto our analysis. Not only are we resting at support but we have gotten buy indications by the Oscillator. My price target for this is a squeeze to 238.
Bullish Signals
-Fibonacci Support
-Squeeze indicator
-Oscillator
Price Target
-238

CAT pullback for a 5 wave move up?I have been patiently waiting for a pullback to enter CAT for a possible 5 wave move up


Fantastic Swing Setup(BULLISH)Cat has hit its Fibonacci Support and bounced off of it significantly allowing for the potential to get in on the up-move. We've recently seen the Williams %R signal a buy target and then increase allowing for a greater amount of bullish sentiment to be surrounding this play. The squeeze indicator on the Daily also displays that of a potential bullish squeeze to be coming. My price target is 130, but believe it will go higher in the long run.
Bullish Signals
-Williams %R
-Squeeze
-Fibonacci Support
Price Targets
-1st 230
-2nd 247

CAT realigns the squiggle lines and makes a moveI start a lot of trades out by looking at the 30m chart to see if it appears to be doing something "new", very much like CAT did today.
She finally got the squiggly lines in a nice and tight formation and made haste to start closing time periods higher. As much as I really feel psyched out by the slow grind, I really had to fight myself to just hold this overnight. After all, the premise is, when a trade works right out of the gate, you'd say you've got to hold it.
I've spent a lot of time looking for a particular sequence on this time period within context of "finding a low". Consider it the formation of a double bottom. Price was correcting, but then makes 2 bullish candles in a row. Ideally somewhat tight and within a range, but clearly as to say that the buyers are stepping in. Seeing a Red candle to retrace some of the two without closing below, and then a follow-up Green candle, and I'm taking that against the low that was made.
But when I saw CAT make that kind of close over many hours of prior price action and aligned it with the 4 hour chart, mm mm mm, had to be in that.
The nuance will be where you define a Target and whether you'd be able to hold through a downward thrust. Hard to think that the Bears will just let it run.
The alignment with the catch-up that we appear to be getting in the DIA and it looks good to me.


$CAT Chart IdeaTough to say which direction the daily chop breaks out of, however my main theory is that we will see a test of both the support and resistance TL's at least once before a breakout of this consolidation. The reason I say this is because we only have two points confirming the TL on both sides so far and it looks like we will consolidate in this pennant for the better part of July so we have some time.

$CAT Chart IdeasMy leading theory is bullish because of the wick on the last candle and the gap up on 7/9. Otherwise there is a bit of room to fall before it gets eaten up.


Weekly Outlook! 7/12 - 7/16Here is what stocks we are looking at for the coming week! As well as a recap of last week's video!
NYSE:CAT
Looking for another swing high off of lows. Looking to get a confirmation for the break of it's current bullflag pattern over the $220 level.
NASDAQ:NVDA
NVDA has been range bound the last two days between $806 and $788. We will be looking for a range break in either direction of those levels
NASDAQ:ROKU
Nice dip here after the recent run we have seen. Looks like we got a break of resistance and will look to catch the next move higher over the $434 level
NYSE:YUM
Nice trend resistance break on Friday, looking to catch a move over a break of $119 for continuation
NASDAQ:EBAY
Nice bullflag pattern forming here at highs, will look to take the next move up after a break of the $70 level

CAT Long 210.50Daily looks good stoch heading up
higher lows need more vol
Weekly looks great turning up
