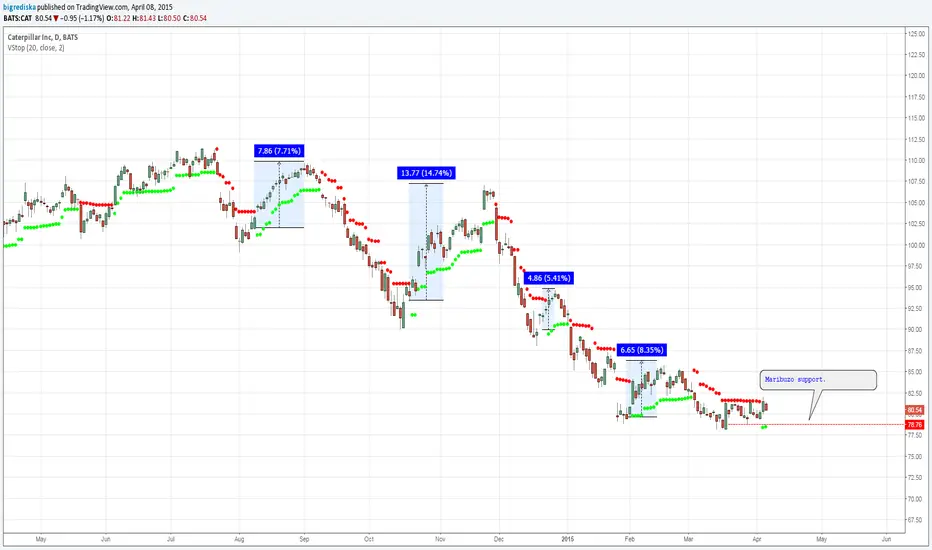
CAT $84.60: Completes a 3-month double bottomCAT broke through the 85.81 range high (February 18, 2015) to complete a 3-month double bottom at 78.81/78.25 before consolidating. The bullish indicators suggest there is scope for further upside. A swing low above the 83.09/81.54 support zone remains favored ahead of further strength through 87.50 (April 23, 2015 high) to open 89.28 (January 8, 21015 lower high). Above there would expose the 94.66 lower high (December 26, 2014) near the 200 day moving average. However, a break below the 81.54 area would prolong the consolidation and retest the 78.76 support (March 27, 2015 low).
Outlook:
Short term: bullish
Long term: neutral
CAT1 trade ideas

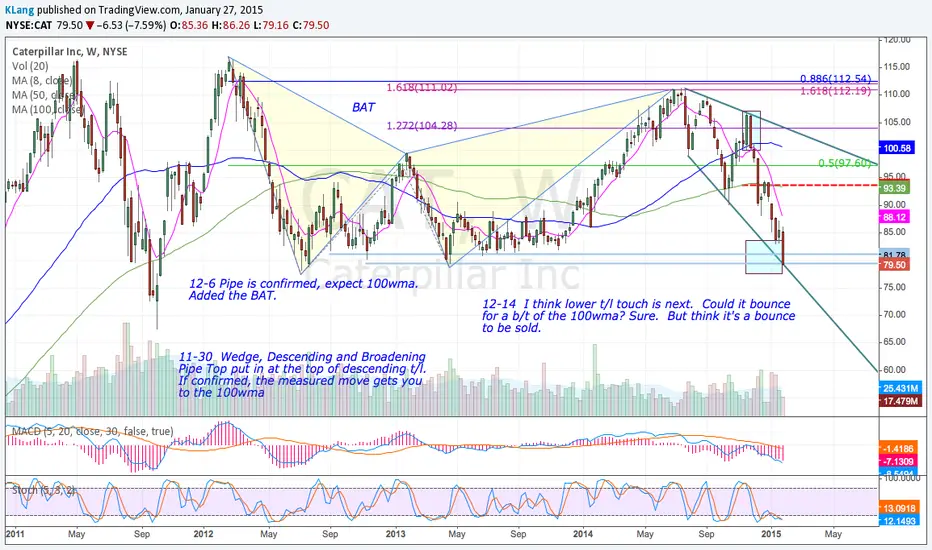
Ending a wave from 112I am showing you a weekly chart that I might keep updated as market action warrants but to get a better idea of my view on CAT, have a look the monthly chart using the link here below.
The bottom line is I think CAT is heading towards 72 to end wave C of a large bullish triangle. So choppy down for a while

Potential Bullish TriangleCAT has the potential to be unfolding in a very large bullish triangle. I am not holding the outlook with blood in my hand but it is a structure to keep an eye on as it might help us to be on the right side of the market. Furthermore, if indeed CAT is moving sideways for a while, we know that triangle precede the last move implying two things: we might have a choppy market before the final leg materializes and end the rally from 2009.
In other words, for the long term it might mean a large bear market might be ahead of us. Probably in a couple of years.
for the short term, have a look at the weekly chart published here.

CAT-confluence of many fib ratios on W1 and D1The weekly chart shows us a bounce on a very strong support and fib ratio confluence.
The daily chart also gives an inverse SHS pattern.
Good Luch

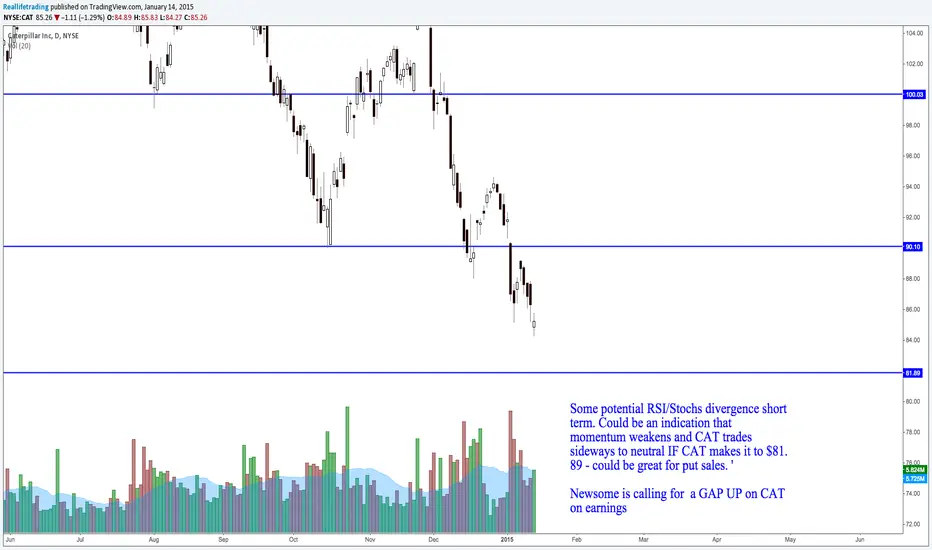
CAT Day Trade Perfect Gap N Go (Brad Reed Jan27,2015)CAT expected to open at 79.56 for a Perfect Gap N Go. To learn to trade this strategy for free go to www.RealLifeTrading.com

Future perspective on CAT Some potential RSI/Stochs divergence short term. Could be an indication that momentum weakens and CAT trades sideways to neutral IF CAT makes it to $81.89 - could be great for put sales. '
Newsome is calling for a GAP UP on CAT on earnings
CAT High Vol, then another dip lower IMO2008 and 2011 there was very high vol before another move lower (red boxes), call it the after glow of the oil drop, which this time could be worse. China not looking good at all. Deflation worries everywhere but here in the US? Think of what this will do to real estate prices, especially China already has ghost towns, and those banks, can govt bail them all out? Oil companies, oil loans, and those banks,m who will bail them out? Case Schiller said we are topping now. Every other currency debasing, and high yields chasers are running out of options. Does not look good folks. If these , and Greece failure, and Germany's love for austerity derails a Euro QE, wow. Could bring about a need for global QE , maybe 5 trillion, to bail everybody out, hey maybe we will all gets checks in the mail from....? About ready to jump in the gold miners swimming pool. My big toe is in the water. AT has what 65 to 70% business outside US? Might wait out this High Vol period in cash, and watch closely for another major dip, which would either lead or follow and major market correction, coming soon to a theatre near you.
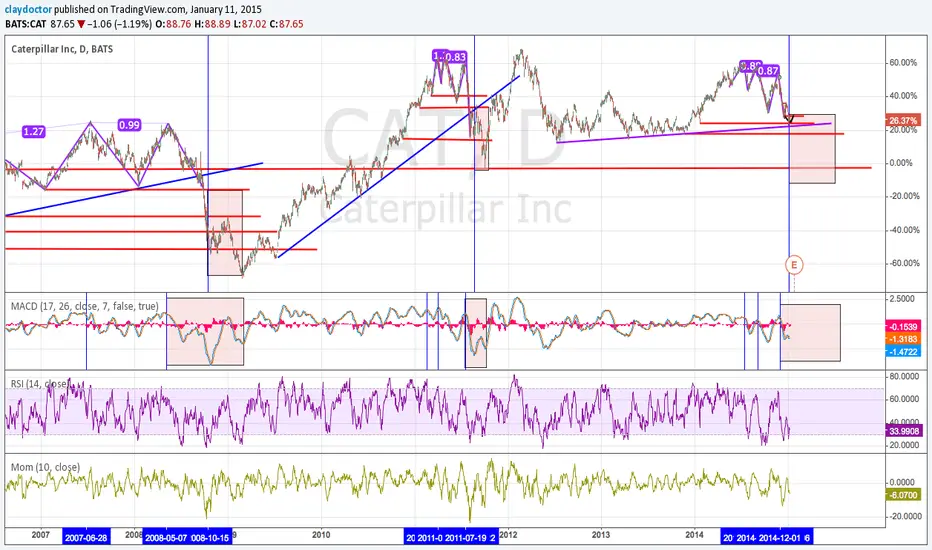
CAT updatea couple things can happen from here. CAT, by percentage was the greatest looser of its piers yesterday. Previous post, was wondering if I was wrong, and we might have an ABCD up. But kept puts in play, still in play. Could hit TL and bounce, but how strong, and complete the ABCD down to overall TL, whgich would confirm moon cycle "gravity" effects right on cue (vertical lines).


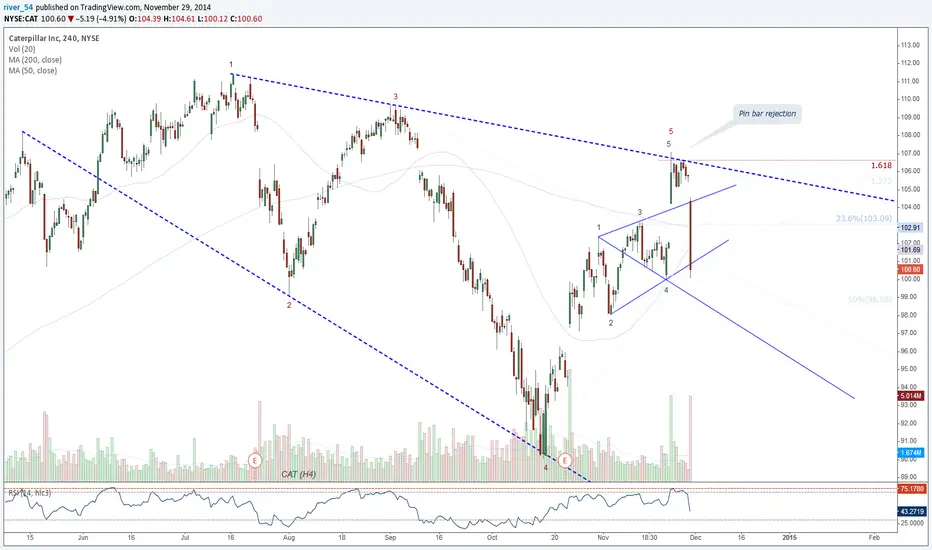
CAT (H4). Wolfe Waves action. ( reView )CAT (H4)
Within diagonal 5 wave formation 'Channel' resistance (1-3-5), rejection pin bar, ending in Wolfe waves 5, targeting 1-4 Line.
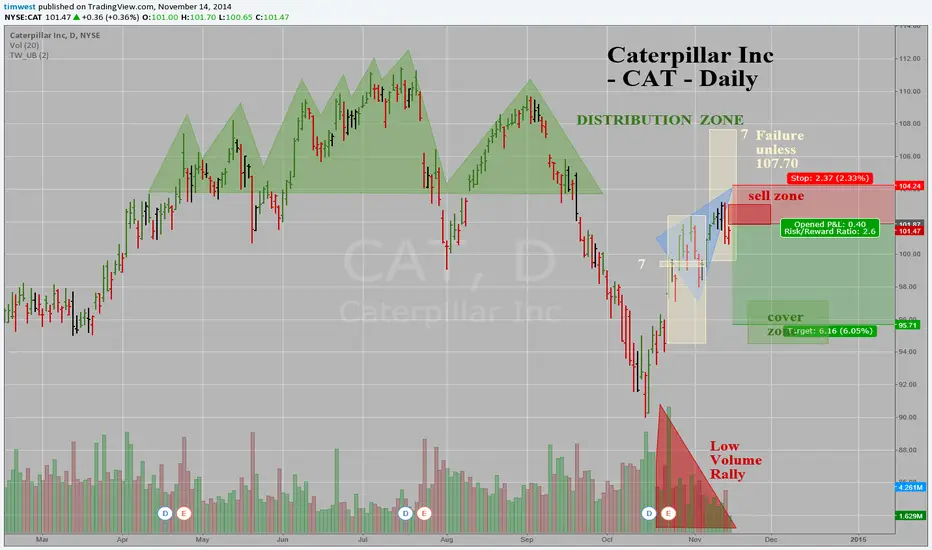
Caterpillar Inc -CAT -Daily -Retest of Distribution Top - ShortThe chart shows the pattern, setup, triggers, stops and targets.
The trade sets up from the low volume rally back to the frequent trading zone over 104, up to 110.
There is a "time at mode" buy signal that is failing quite dramatically if CAT doesn't reach 107.70 by Monday's close of trading. The downside target appears to be at the 96 level (+1/-1, or 97-95). Stops are just over the recent swing high plus a point or so. Stops @ 104.20 and up.
Tim November 14, 2014 3:30PM EST 101.39 last.
Bearish Continuation Wedge (How Reliable It's)$CAT was low risk short-candidate as it approached 38.2% FIB. Posting earning momentum faded away as price approached that resistance, and if price reverse from here it may suggest a higher probability that we may see a new low or new lower low that will be hard to believe after strong earning and guiding higher. Not many analyst increased their outlook or EPS last few weeks after earning. From technical point of view, price seems to roll back to recent gains. A Continuation Wedge (Bearish) represents a temporary interruption to a downtrend, taking the shape of two converging trendlines both slanted upward against the trend. During this time the bulls attempt to win over the bears, but in the end the bears triumph as the break below the lower trendline signals a continuation of the prior downtrend. If you decide to take short position, make your stop loss at recent swing high at and around 103 area. If you want a real time alert try us www.2waytrading.com

Too much negativity for a long position.I closed my long position and waiting for the reaction at this level, in order to decide what to do next.
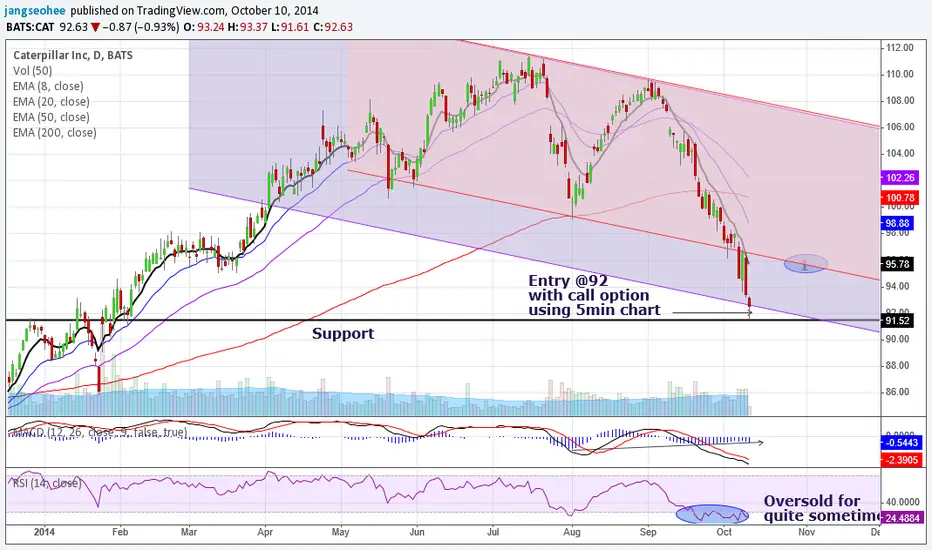
Extended ChannelEver since the top at 111, Caterpillar has drop 18% to 91.52.
Seeing a mild histogram bullish divergence, RSI oversold for quite sometime and support at 91.52, call option @ strike 92 was triggered.
The downtrend channel is more advanced, with extended version
$CAT - daily chartCaterpillar just broke down through its 200 day moving average for the first time since January.
Last time was a buying opportunity...
...Is this time different?
The daily Williams %R remains below -20; this indicates negative pressure.
If $CAT can't hold above ~$98 then it could fall to $92.19 and then ~$90.

Neckline = Channel BottomSince making a TOP in May 2011 around 117, Caterpillar wasn't able to make another high, it merely retest previous top and subsequently freefall to ard 80.
From the latest development, price of caterpillar is engaged in a downtrend channel.
Coincidentally, a 100% Head & Shoulder pattern just formed after friday's closed, moreover, the neckline is also part of the channel bottom support.
We will see on Monday how strong the support is.

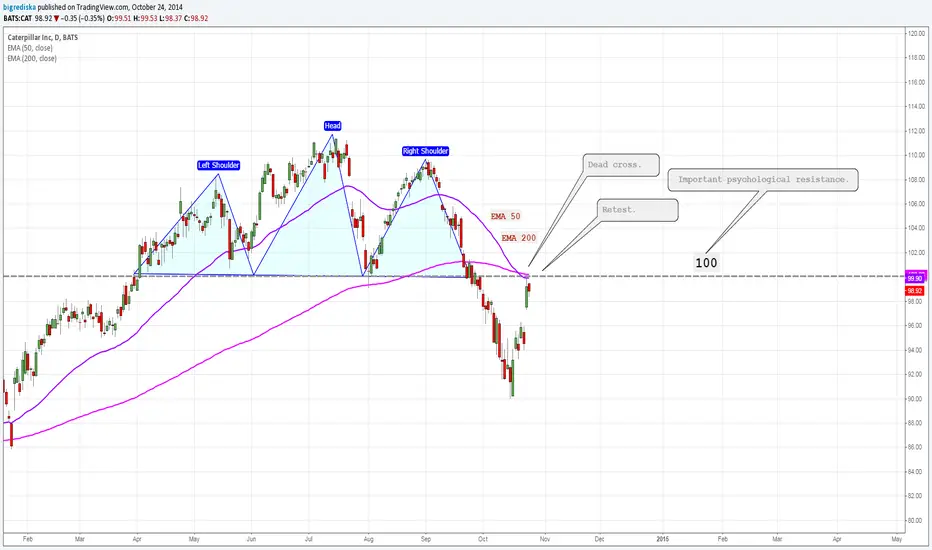
CAT, potential bullish divergenceCAT is in Topping H&S pattern since Apr 2014.
The thick neckline holds the key to future movement of this stock.
Albeit it look bearish in price, but MACD is showing some sign of bullish divergence.
