CAT : Unlocking Upside Potential with a $290 TargetCaterpillar Inc (CAT) has recently demonstrated significant upside potential according to the latest technical analysis. Let's delve into key points supporting this positive outlook:
Recent Developments:
On October 31, 2023, CAT's stock price touched a critical support area at $228.37, marking its lowest level since June 2023. The significance of this level is reinforced by the presence of a long-term upward trendline dating back to March 2021. This underscores strong demand at this level, signaling the continuation of the upward trend.
Positive Reversal:
Following the support touch, CAT shares experienced a positive reversal by successfully breaking through the previous resistance level at $244.24 on November 3, 2023. This indicates an increased buying pressure, suggesting that CAT has the potential to continue its ascent to higher levels.
Target Price Set:
The proposed target price is around $290, reflecting the highest level reached in August 2023. This target selection is based on psychological aspects and the Highest level of all time
Momentum Indicator Support:
Two key momentum indicators, MACD (Moving Average Convergence Divergence) and RSI (Relative Strength Index), provide positive signals:
MACD is above its signal line and the zero level, indicating that upward momentum is increasing, supporting the continuity of the uptrend.
RSI has moved above the 50 level and is approaching 70, suggesting that CAT may be in an overbought condition. This indicates a higher number of buyers than sellers, supporting the prediction of price increases.
Conclusion:
Based on this in-depth technical analysis, Caterpillar Inc (CAT) shows robust potential for upside movement. However, as with any investment decision, it is advisable to conduct further research and consider risk factors before making decisions. Stay informed about the latest news that may impact the overall stock market.
CAT1 trade ideas

CAT Caterpillar Options Ahead of EarningsAnalyzing the options chain and the chart patterns of CAT Caterpillar prior to the earnings report this week,
I would consider purchasing the 237.5usd strike price Puts with
an expiration date of 2023-11-3,
for a premium of approximately $6.20.
If these options prove to be profitable prior to the earnings release, I would sell at least half of them.
Looking forward to read your opinion about it.

CAT AVWAP Bounce Idea?Caterpillar Inc. (CAT) - Revised Trade Strategy
Trade Setup: Anchored VWAP (AVWAP) Reversal Play
Rationale:
Post-earnings, Day 1 concluded with a bearish spinning top despite substantial volume, indicating indecision yet CAT’s price retained above the critical support level of $225. My initial bias was towards shorting on a potential breakdown below this support. However, the subsequent formation of a highly bullish candle that closed above the high of the previous earnings-related candle has shifted my stance towards a bullish outlook.
Execution Plan:
Monitor the 15-minute chart for a retracement to the AVWAP.
The stock must engage with the AVWAP to confirm its relevance as a dynamic support level.
Absent a touch of the AVWAP, the entry setup is invalidated, and no position will be taken.
A confirmed test of the AVWAP followed by a close above it will signify a shift in momentum to the buyers.
Upon this confirmation, a Limit Stop order will be placed just above a defined intraday resistance level. Concurrently, a Stop Loss will be established beneath an intraday pivot point, which also lies below the AVWAP, to mitigate risk.
Profit Targets:
The initial target is set at $233.72. Upon breaching this level, the next objective will be $240.00.
Half of the position will be exited at a profit level equivalent to 1.5 times the risk assumed from the entry point.
Risk Adjustments:
Continuous evaluation of the trade will occur, and further updates will be disseminated. This strategy, while more nuanced to articulate, is predicated on clear technical confirmations, making it more straightforward to execute in practice than to describe.

Caterpillar Inc (CAT) Reports 12% Increase in Q3 2023 SalesCaterpillar Inc (NYSE:CAT) reports Q3 2023 sales and revenues of $16.8 billion, a 12% increase compared to Q3 2022.
Profit per share for Q3 2023 stands at $5.45, a significant increase from $3.87 in Q3 2022.
The company returned $1.0 billion to shareholders through dividends and share repurchases in Q3 2023.
Operating profit margin for Q3 2023 was 20.5%, compared to 16.2% in Q3 2022.
On Tuesday, October 31, 2023, Caterpillar Inc (NYSE:CAT) released its third-quarter earnings report for 2023. The company reported a 12% increase in sales and revenues, which stood at $16.8 billion, compared to $15.0 billion in the third quarter of 2022. This increase was primarily due to favorable price realization and higher sales volume.
Financial Highlights
The company's profit per share for the third quarter of 2023 was $5.45, compared to $3.87 in the third quarter of 2022. The adjusted profit per share for Q3 2023 was $5.52, compared to $3.95 in Q3 2022. The company also returned $1.0 billion to shareholders through dividends and share repurchases in the quarter.
Operating profit margin for the third quarter of 2023 was 20.5%, compared to 16.2% in the third quarter of 2022. The adjusted operating profit margin for Q3 2023 was 20.8%, compared to 16.5% in Q3 2022.
Performance Analysis
For the nine months ended September 30, 2023, the company's enterprise operating cash flow was $8.9 billion. The company ended the third quarter with $6.5 billion of enterprise cash. In the quarter, the company paid dividends of $0.7 billion and repurchased $0.4 billion of Caterpillar common stock.
Caterpillar Inc (NYSE:CAT) continues to focus on supporting its customers' success and executing its strategy for long-term profitable growth.
Price Momentum
CAT is trading near the bottom of its 52-week range and below its 200-day simple moving average. Investors have been pushing the share price lower, and the stock still appears to have downward momentum which will find a support level and surged prior to 12% Increase in sales we should expect a surged in the stock's value.

Is not a bad idea Market has punished unfairly this stock after earnings. It way overreacted. This is good company and earnings weren't bad at all. It will go up very soon. I bought some calls (you can just buy the stock and hold it forever is that good). Expr Nov 10 strike 230. Careful with the 238 resistance, you may want to close almost all your calls on that level.

Window ClosedYesterday we had opened with a gap up. This window has been closed today what opens the way up again. Mind that we are holding above the MA that serves as a support here.
Long term short CAT to $143I have absolutely nailed this stock in the past (with my dowsing)... Like the lows at $162 wayyy back when. I lost track of it though & was of course disappointed once I saw the rally. I didn't know what I had!
Now though, I have today's date as a time to check up on CAT & isn't it interesting it's right near it's highs?! (I start salivating a bit) Dates in my work are often reversals and I did have a date at those lows at $162. I actually, had price too.
Today's date was given on 2 occasions earlier this summer when I must've check in CAT, but I haven't been following it lately.
What is the dowsing suggesting? CAT is at "very long term resistance" and I asked what price it goes to, which gave me $141, and a percent down of 50%, which conveniently lands it at $143!
I'm expecting this to occur over the next 14 months. I may have missed the rally, but I shall not miss this. Be aware as the market pops later this week CAT may get to $288 +/-, & there is a near term date of 9/12. In the big picture I don't think it matters. Also, be aware it may have a choppy range for a while too.

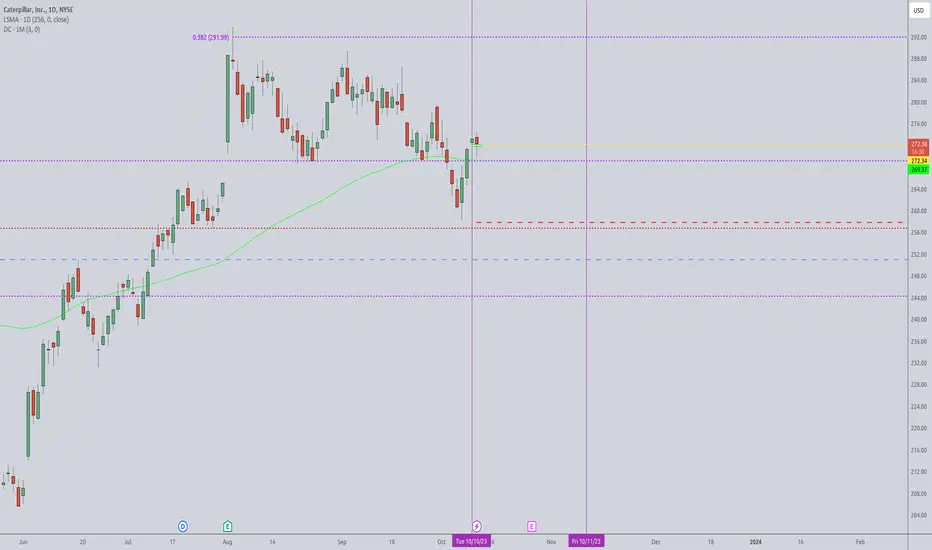
Descending TriamgleTop line is resistance and the bottom line is support.
Price is on support. Once this support is broken, it becomes resistance.
Top line slopes down and bottom line is virtually flat forming a Descending Triangle.
There is a rising wedge below price that is bearish if price breaks the bottom line of the wedge.
No recommendation.
Neutral until bottom line is cleanly broken.
CAT, Formed EXPLOSIVE BULL-FLAG-BREAKOUT, Extension Prevails!Hello There!
Welcome to my new analysis about CAT Stock Price Action Analysis on the Weekly Timeframe Perspectives. The CAT Price Action recently showed up with a highly important dynamic and in this case a major formation has been formed that caught my attention. The CAT earnings through the recent quarters look pretty damn solid and the equity-to-debt ratio held stable through the recent quarters indicating a substantially fundamental base from where CAT has a strong potential to be backed from a financial market investors open-interest perspective. While other sector stocks showed up with pullbacks CAT moved on to form new highs. Such dynamics are pointing to a interesting stock price-action dynamic that should be considered in the schedule.
When looking at my chart now I have marked there this huge bull-flag-formation which CAT has built during the last times. Within this formation CAT moved on to form a new higher high exceeding the previous one into an all time high as well as several higher lows that supported the bull-flag-formation to be completed with the breakout above the upper boundary. CAT also bounced several times within the 65-EMA in blue and the 25-SMA in green building substantial support-structures in combination with the main ascending-trend-line. The wave-count within the bull-flag-formation has been completed appropriately and from there on the final breakout above the upper-boundary has been validated by the bullish volume.
The major formation that CAT recently completed here has now activated the upper target-zones as marked in the chart together with the major wave-C to emerge out of the breakout-origin. The fact that the waves A and B have already completed give the breakout and wave-C extension a fundamental base for the expansion to show up within the next times. The setup and indications that CAT provided here are delicate for an main positioning into the bullish direction and it has to be remarked that not every stock is showing such concrete factors into the appropriate direction this is why CAT is a main considerable stock-pick that we will keep following on the watchlist.
Within the near terms a final setup-determination above the upper-boundary of the formation as seen in my chart is likely and from there on the wave-C expansion-wave will determine to reach out the upper-target-zones. Once the zones have been reached further assumptions need to be made. Especially a continued healthy equity management of the company can support the bullish case massively.
In this manner, thank you everybody for watching the analysis, support from your side is greatly appreciated.
VP

CAT - another leg down likelyShould the red bar and wedge breakdown, there will be a lot of longs that got in recently on the large uptrending bar that started the wedge looking to get out (see Vol). Momentum indicator also showing a new bearish phase has started.

Caterpillar: Metamorphosis 🐛🦋The Caterpillar share price has been experiencing ups and downs lately and has not quite been able to approach the resistance at $293.88. However, we anticipate that this breakthrough is imminent. With the low placed at the end of August, the price is currently in the turquoise wave 5, which should reach the green target zone between $325.21 and 358.93 and represents the end of the superior white wave (I). A fall below the support at $250.89 would put a spanner in the works. Then, our 36% likely alternative would activate, and the price would move further down.

📈📊 #ChartPattern Alert! 📈📊📈📊 #ChartPattern Alert! 📈📊
📈 Ascending Channel 📈
📈 What is an Ascending Channel? The Ascending Channel is a bullish chart pattern formed by two parallel trendlines containing the price action within a rising channel. The lower trendline connects higher lows, while the upper trendline joins higher highs.
📈 How to Identify:
Draw a trendline connecting at least two higher lows (ascending support) and another trendline connecting at least two higher highs (ascending resistance).
📈 What it Signals: The Ascending Channel suggests a healthy uptrend, with buyers stepping in at higher lows, showing increasing demand. The price tends to move between these parallel lines, providing potential trading opportunities.
📈 Trade Strategy:
Consider buying near the lower trendline support and selling near the upper trendline resistance.
Implement a stop-loss to manage risk in case of a breakdown below the channel.
Remember to combine the Ascending Channel pattern with other technical indicators and conduct thorough research before making any trading decisions. Happy charting and trading! 📈💹

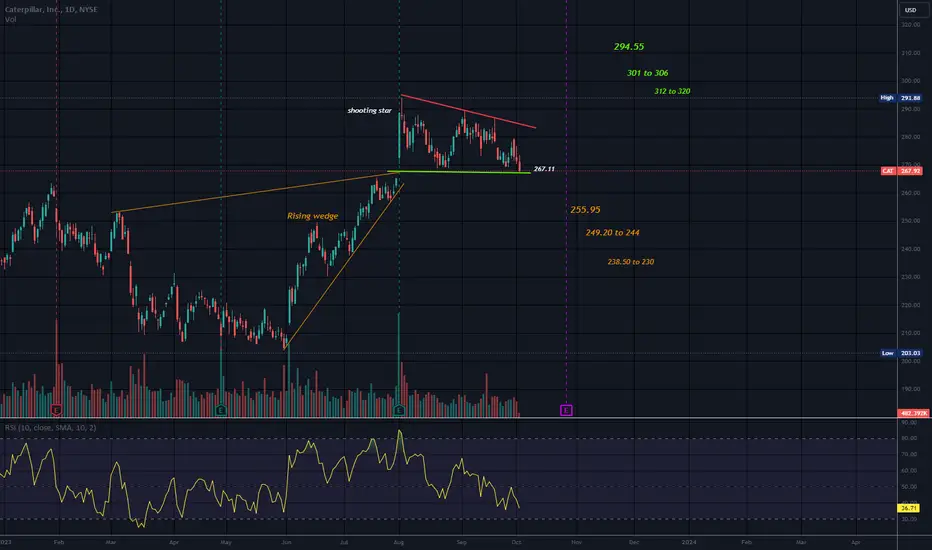
Has CAT Run out of Lives?Caterpillar has been leading a rally in industrial stocks, but now some traders may expect a pullback.
Notice the gap to new record levels on August 1 after earnings beat estimates. CAT pushed to another high the following session but failed to hold and closed in the red. That kind of “shooting star” candlestick is a potential reversal pattern.
Second, the surge pushed Wilder’s Relative Strength Index (RSI) far into overbought territory. It’s now retreating from that condition.
Third, a narrowing price range since the rally produced a triangle. Prices broke the bottom of that formation yesterday. They also closed below their 8-day exponential moving average (EMA) for the first time this month.
Traders looking to the downside may target the $270 area or lower, which corresponds to the recent gap.
The macro backdrop could also worry some investors, given China’s economic weakness lately.
TradeStation has, for decades, advanced the trading industry, providing access to stocks, options, futures and cryptocurrencies. See our Overview for more.
Important Information
TradeStation Securities, Inc., TradeStation Crypto, Inc., and TradeStation Technologies, Inc. are each wholly owned subsidiaries of TradeStation Group, Inc., all operating, and providing products and services, under the TradeStation brand and trademark. TradeStation Crypto, Inc. offers to self-directed investors and traders cryptocurrency brokerage services. It is neither licensed with the SEC or the CFTC nor is it a Member of NFA. When applying for, or purchasing, accounts, subscriptions, products, and services, it is important that you know which company you will be dealing with. Please click here for further important information explaining what this means.
This content is for informational and educational purposes only. This is not a recommendation regarding any investment or investment strategy. Any opinions expressed herein are those of the author and do not represent the views or opinions of TradeStation or any of its affiliates.
Investing involves risks. Past performance, whether actual or indicated by historical tests of strategies, is no guarantee of future performance or success. There is a possibility that you may sustain a loss equal to or greater than your entire investment regardless of which asset class you trade (equities, options, futures, or digital assets); therefore, you should not invest or risk money that you cannot afford to lose. Before trading any asset class, first read the relevant risk disclosure statements on the Important Documents page, found here: www.tradestation.com .

Bullish Pennant on Caterpillar IncA bullish pennant is a chart pattern that often indicates a continuation of a uptrend after a brief consolidation phase. It is formed when there is a sharp price incline (flagpole) followed by a period of consolidation, represented by converging trendlines that resemble a pennant shape. This pattern suggests that the buying pressure remains strong, and after the consolidation, the uptrend is likely to resume.
Entry Point: At the breakout
The entry point for a bullish pennant trading signal is when the price breaks above the upper trendline of the pennant pattern. This breakout confirms the continuation of the uptrend and signals a potential buying opportunity. If consolidation continues inside bearish pennant pattern entry point can be adjusted for decline of upper line of a pennant.
Stop Loss: $281.00
To manage risk, it is advisable to place a stop-loss order just below the lower trendline of the pennant pattern. If the price breaks below this level, it may invalidate the bullish signal, and the trade should be exited to limit potential losses. If consolidation continues inside bearish pennant pattern stop loss should be adjusted for incline of bottom trendline of a pennant.
Target Price 1: $310.00
The target price for bearish pennant can be estimated by measuring the height of the flagpole (the initial sharp price incline) and projecting it upward from the breakout point.
Target price for bears: 260.00


CAT 9ma bounce and sector rotationCAT 9ma bounce and possible name in a sector rotation toward industrials. Showing good relative strength. Episodic pivot as well.

Looking reasonable to start a short positionInto 11th "up" week, although we not at the top of a long term parallel channel, this is close enough for my starter position. Just looking for a 10% - 15% pullback. I am not trying to catch the top, just inching in and will add to it if price goes up...

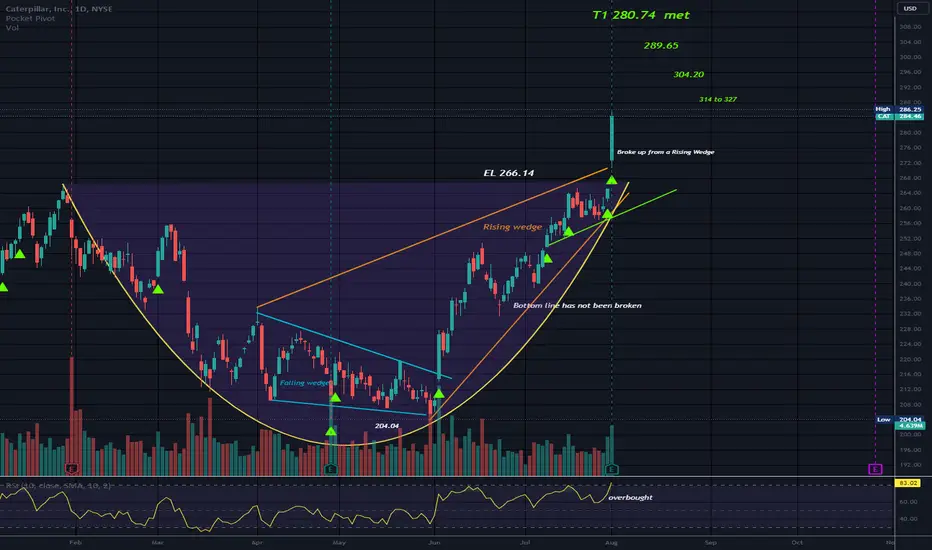
Cup and Handle/Rising WedgeEarnings beat.
Conflicting patterns as a cup is bullish and the wedge is bearish. Rising wedges are not valid until the bottom line is broken, so this wedge is not valid as of yet.
Rising wedges can also break to the upside which this one did. Some would say a RW is caused by FOMO.
It exhibits too much excitement and it causes too much supply. When price comes back down to break the wedge, there will be excessive selling but not until then.
I have not seen a RW that was not eventually broken but they can be a long term pattern depending on market sentiment.
The cup reached EL (long entry) level with the earnings beat. Targets for a cup are calculated using the depth of the cup. T1 has been reached. Targets calculated but the rising wedge could mess with this cup and cause a throwback. This is a large Rising Wedge (RW). It remains to be seen.
There is a falling wedge at the bottom of the cup. This is opposite of a RW. Both lines slope down and converge at the apex. A Falling Wedge is bullish when the top line is broken.
No recommendation
CAT breakaway gapWill this breakaway gap in NYSE:CAT establish a new uptrend? Gaps occur when the low price of the current day is higher than the high price of the previous day. The majority of gaps are filled over time, but a sudden gap fill usually indicates a trend reversal. A breakaway gap occurs at the beginning of a trend after a period of consolidation, similar to what we've observed with CAT in October 2022 and in a downtrend in March 2023.
We can project the outcome after a breakaway gap by measuring the vertical distance from the most recent swing low to the middle of the gap, and then using that same distance from the center of the gap to project the next local top of the trend.
For this opportunity I will take advantage of the pullback from the market reaction to Fitch downgrading the US credit rating to enter below yesterdays close. I'll target ~$301 to take profit, which is near the top of the measured move and aligned with the 1.618 fib of the retrace from January to May. My initial stop loss is set at the gap open $270 and will be adjusted as a trailing stop to protect profit as the trend matures.

DANGER | Caterpillar Inc Short 🐛The indicators of economic distress are vast.
Sometimes I don't know what to post, but you have to post something to trick the little AI bot police.
Anyway, lately things have been feeling a lot like the summer / autumn of 2008. Rampant fomo everywhere, but you can tell the market is getting tired, after a ridiculous full-employment rally.
So now, we have CAT (and plenty of others) showing us highs and corrective formations; meanwhile - the UNRATE remains in an increasingly unsustainable territory.
Save your money.

CAT: Ascending Triangle, Not confirmed (38,39%)(9/1000)(9/1000)
Ascending Triangle for Caterpillar.
Not Confirmed yet.
Pros:
1- Bullish Ascending triangle
2- Descending volume during formation
3- PPS above 50MA and 200MA
4- R/R ratio above 5
5- 250RSI above 50 and climbing
6- 50MA above 200MA
7- 50MA and 200MA ascending.
8- RS above 0
Cons:
1- ATR is descending, less volatile
2- Triangle not confirmed yet
Target price is 364.95$.
Again, stay humble, have fun, make money!
MAAX!

CAT, Caterpillar, to re-test support 220, then back to 250CAT (Caterpillar),
On the daily chart, the technical indicators show a high probability for the stock to test the support level 220. Then the stock will rebound to 250, and target 265.
Short-term stop loss to be considered at 200

CAT is going diggingAfter a long period being overpriced CAT is getting a price correction. And later this year it will go to 240 which is a normal price for such a company.
