CDM1 trade ideas
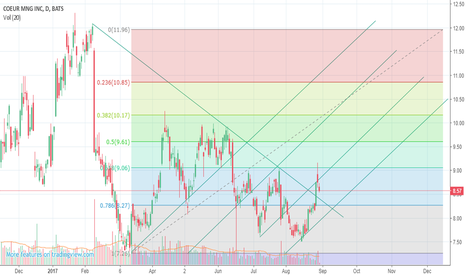
Coeur Mining: renwed uptrendCDE has ended the steady and rather drawnout counter trend phase since mid-2016 with the break above ~9.05. A strong upmove towards minimally 11.75 (1st projection) is extremely likely. Secondary targets come in at 14.30 (3-4 months) while the long-term forecasts suggest levels well above 17.50 (12-months+). Maintain initial stops below 8.25.
Bullish Gold Futures = Mining Companies (#2 CDE)This is a triangle in progress and this one has taken one year and four months to take shape. The support level around 7.20 has been relevant in the past (without be to precise)
But now why I care is the resistance line in the triangle. This is not a confirmed resistance breakout yet but I shared the idea because other Companies in this same Industry/Sector are more advanced and they have already broken resistance line due to the Bullish Gold Futures.
The reason why I will buy tomorrow Coeur Mining Stocks!Hey Guyz,
Coeur Mining is the biggest US Producer of Silver. Since Silver and Gold are currently changing from bearish to bullish mode - I believe - that the mines will follow.
Same we can observe at Barrick and Newmont.
Since Coeur has a good price level close above the 61.8 Fib, and approx. 84 % potential to the recent high in august of last year at 16.40, I believe that this purchase will be a nice chance for my portfolio.
Cheers
Possible $2 gain swinging CDE?One week chart shows an accumulation phase with S/R @ 7.83 and 9.91 respectively. The daily chart shows strong resistance @ 9.82. Based on previous entries at my suggested buy point the swing appears to take around eight trading days.
Using my Buy, Stop, and Sell points. This setup has a risk percentage of 3. With a stock reward per share of 2.05 and a R:R of 1.9.
That said, I had a limit buy for $7.86 and got in this morning @ $7.70. However, I quickly got stopped out @ 7.66. Maybe I should have set my activation price closer to the my actually stop price. Or, maybe my stop price was a little too tight. Regardless, I stuck to my plan and I can live with the results. On to the next trade setup :)


