$CELH Celsius Holdings, Inc. Major 0.786 Fib Having dropped below the breakout level, the stock has now found itself on the Lifetime 0.786 Fib.
Bulls will be very nervous if this fails.
CELH trade ideas

A Brutal Lesson in Risk ManagementIt's always risky trying to pick bottoms. Anyone who has held this stock in the last 18 months has been punished. This is why risk management is important, especially if you're playing the game of catching a bottom or 'buying the dip'. Understanding technical analysis is important, but also understanding how to define your risk and managing it accordingly.
I prefer to wait for a reaction at support when the downtrend is so strong. Technically we could find some support her between $21-22. There's a confluence of factors here:
-0.786 Fibonacci Retracement Level
-Value Area Low of the range
-Daily support level
-Bullish RSI divergence
I will be waiting for a reaction at these level and I will be taking my trade accordingly. Any loss of support at this level would indicate we are heading lower, to the long term support line at $10.
Not financial advice, do what's best for you.

2/4/25 - $celh - I'm buying some back... sub $242/4/25 :: VROCKSTAR :: NASDAQ:CELH
I'm buying some back... sub $24
- ripped out of my position prior to last earnings
- mgmt not the best
- but dayum these beverages are so good
- yes they're seasonal, but int'l expansion, 25x PE for a brand producing decent cash $200 mm? on 5.5 bn EV... is >3.5% FCF yield.
- it's trading like it's NYSE:ELF but with inventory issues behind it
- perhaps it's the PEP results today, will have to check in with those folks later
- this is one where *maybe* you get it at sub $20. idk. it's not going to be a big position for me in this tape until we get some incremental lift on the sector or the stock
- but valuation now entering what i'd call extreme LT zone
- i think max downside maybe 18-20... and upside in the LT is clearly still in the 40s and above - so i like that skew, but i'm chewing slowly given scanner data a bit light lately
V

Celsius Rising Wedgebullish options chain with rising wedge. looking for 27.50 breakout for 30.00 price target.

$CELH - Could be bottomedNASDAQ:CELH Celsius Holdings is sitting on a lower trendline and a Fibonacci extension support. There are two wedges in play.
The MACD is starting to narrow, and the RSI is curling up, indicating that a reversal may be in the cards.
Targets are shown on the chart.
As always, I share my opinions and trades. I'm not suggesting anyone follow my trades. You do you.

Strength building up.We are at end of wave c correction. Good chance of resuming higher. Look forward to earning catalyst.

Double bottom by the way Price reached minimum again
Double bottom pattern by the way but price must close a candle above 32$ to confirm

CELH Buy Setup - 1/27 Risk/Reward Opportunity at Strong SupportNASDAQ:CELH is offering another great buying opportunity after my stop-loss was triggered earlier (previous idea linked below). The price has returned to a strong support level, aligned with a bullish trendline that’s been guiding the stock upward. A small double bottom has formed, adding further confidence to the setup, alongside a bullish engulfing pattern and increased buying volume.
The setup offers a solid 1:27 risk-to-reward ratio, with the next target being the all-time high (ATH). If support holds, there’s significant upside potential ahead.

CELH Technical Analysis and GEX Insights-Jan.8
Technical Analysis (30-Minute Chart and 1-Hour Chart)
* Trend and Price Action:
* CELH is currently trading within a well-defined upward channel, indicating a bullish structure with higher highs and higher lows.
* Price is consolidating near the $29.40-$29.67 region, with upward momentum testing resistance at $30.50.
* Volume: Rising volume near resistance, signaling increasing market activity and potential for a breakout.
* Indicators:
* MACD: Bullish crossover on the 30-minute chart, confirming upward momentum.
* Stochastic RSI: Near overbought levels, suggesting caution for potential pullback or consolidation.
* Key Levels:
* Support Levels:
* $29.00: Immediate support zone, coinciding with previous consolidation.
* $26.50: A significant support area, backed by historical price action and PUT wall activity.
* $24.50: Major support and the lowest PUT wall, signaling strong downside protection.
* Resistance Levels:
* $30.50: Immediate resistance, with a breakout potentially leading to $32.00.
* $32.00: Key resistance aligned with CALL wall activity and psychological level.
* $33.00: Extended resistance zone with significant gamma exposure.
GEX Insights for CELH
* Gamma Exposure (GEX):
* Positive GEX Zones:
* $30.50-$32.00: Significant CALL wall activity, indicating resistance and potential gamma-related hedging pressure.
* $33.00: Strong CALL wall, acting as a target level for bullish continuation.
* Negative GEX Zones:
* $29.00: Moderate PUT activity, providing near-term support.
* $26.50-$24.50: High negative gamma exposure, marking critical support areas.
* Options Metrics:
* IVR (Implied Volatility Rank): 44.7%, indicating moderate options pricing.
* Options Flow:
* CALLs: Dominant near $30.50 and $32.00, reflecting bullish sentiment.
* PUTs: Concentrated below $29.00, highlighting downside protection positioning.
Trade Scenarios:
Bullish Scenario:
* Entry: Above $30.00 with confirmation of breakout volume.
* Target: $32.00 (initial), $33.00 (extended).
* Stop-Loss: Below $29.00 to limit downside risk.
Bearish Scenario:
* Entry: Below $28.80 with strong selling volume.
* Target: $26.50 (initial), $24.50 (extended).
* Stop-Loss: Above $29.50 to cap losses.
Conclusion
CELH is trading within an upward channel, with $30.50 acting as immediate resistance. A breakout above this level could drive prices toward $32.00 or higher. Conversely, failure to hold $29.00 may lead to a pullback toward $26.50. GEX data highlights these levels as pivotal zones for price action and options-related activity.
Disclaimer: This analysis is for educational purposes only and does not constitute financial advice. Always conduct your own research and manage risk responsibly.
Let me know if you'd like further details or refinements!

$CELH Bounce Back January 2025 | +30% to +55% Upside PotentialNASDAQ:CELH
Celsius is going through a "drastic narrative issue" due to comments made by the CEO about a $120 million drop in sales. The issue is related to Pepsi orders, not overall sales. Pepsi had been overloading on Celsius inventory over the past year and is now trying to work through that excess inventory. Celsius' actual consumer demand has increased 10% year-over-year, so the sales decline is not a demand issue, but rather a Pepsi inventory management issue.
Celsius' ceiling is limited because Pepsi controls the distribution network, and Celsius has to "kneel to the king of Pepsi" in terms of order volumes. Based on Monster Energy’s multiples, Shay believes a fair valuation at $38-$42 (+40% to +55%). Pepsi’s inventory issue is a short-term headwind and we are confident in Celsius’ long-term growth potential.
On the technical side, there is a beautiful range trade opportunity from $27 up to $36 (+33%).
We are expecting this to bounce back heavily this January.


Why We're CELH LONG: A Bold Bet on Growth and OpportunityWe're CELH LONG based on strong technical confluence: liquidity has been swept, a key high that led to a new low has been taken and confirmed, and our entry aligns with a 4H breaker block and an imbalance from last week's Thursday-to-Friday price action, signaling a high-probability reversal setup.

Celsius (CELH) Set to Skyrocket! Massive Upside Potential 🚀 Celsius Holdings (CELH): Bullish Outlook 📈
Why Celsius is a Strong Buy:
1️⃣ Rapid Market Growth: The energy drink sector is booming, and Celsius is perfectly positioned with its health-focused brand targeting fitness-conscious consumers.
2️⃣ PepsiCo Partnership: With PepsiCo’s $550M investment and its vast distribution network, Celsius is expanding rapidly.
3️⃣ Global Expansion: Entering new markets like Europe and Asia, Celsius is primed for global growth as demand rises worldwide.
4️⃣ Strong Financials:
Q2 2024 Revenue: $402M (+23% YoY) 💰
Gross Profit: $209.1M (+32%) 📊
5️⃣ Health-Oriented Innovation : With the growing demand for low-sugar, healthier alternatives, Celsius is leading the way. Future expansions into protein drinks could attract even more consumers!
6️⃣ Digital Marketing Edge: Celsius has nailed online sales and influencer marketing, especially with Gen Z and Millennials. 📲
7️⃣ Cost Efficiency: The acquisition of Big Beverages will lower costs and boost profit margins.
8️⃣ Analyst Optimism: Experts remain bullish, and the company’s growth trajectory makes it a potential buyout target, offering extra upside. Analysts target a 70-80% upside potential 💹
🔑 Technical Setup & Trading Strategy
Support Zone: Stock is near its ascending trendline at $27–$28, providing strong support.
🎯Take Profit 1: $41 (23.6% retracement) – ~50% gain. 💰
🎯Take Profit 2: $50 (38.2% retracement) – ~78% gain. 💰
🏆Take Profit 3: $65 (61.8% retracement) – ~130% gain. 💰
Stop Loss: $22.50 (below trendline support), limiting downside risk to ~20%
💡Conclusion: Celsius offers strong fundamentals and a bullish technical setup, making it a great pick for both long-term and swing traders. Don’t miss this opportunity to be part of Celsius’ growth! 🌟
What do you think about CELH's growth potential? 🚀 Drop your thoughts and let’s discuss the next big move! 💬👇

CELH - Massive Bullish DivergenceFor the past 6 months, a massive Bullish Divergence has been building.
The daily chart shows the price making lower lows, with momentum dissipating as the RSI and MACD both making higher highs.
For the first time in months there's a chance of a reversal as a higher low in price has been established. A higher, high would give confirmation of resolving this signal to the upside with a $98 target.
One could enter at a favourable risk/reward near the lows given the bullish divergence.

CELSIUS $CELH On the weekly, let’s take a look. Overall I have been ignoring all of the food and health sell offs until further notice however celh looks interesting for a long. Breakout or fake out, either way there’s some bullish divergence on the RSI.

CELH Buy Setup - 1/27 R:R Opportunity at Strong SupportCelsius Holdings NASDAQ:CELH is presenting an excellent long opportunity. The price is currently at a strong support level, aligning with a bullish trendline that has guided the stock upward in the bigger picture. Recently, a bullish engulfing pattern has formed, signaling a potential reversal, which is occurring in a sweet zone where many traders were shaken out of the market. This has been confirmed by a noticeable increase in volume, further indicating that the buying pressure is returning.
The setup offers a fantastic risk-to-reward ratio of 1:27, with the next key level being the all-time high (ATH), which is not far away. This suggests significant upside potential if the support holds.

IDEA $CELH ON WATCHNASDAQ:CELH
CELH looks in an interesting spot below its major long term VPA with increasing volume on weekly/monthly charts. Blue box indicates long term sell/buy zone flip which would mean it will be hard for the price to go below 25. It can break down and go towards 20- if it goes there that would be a great long term spot to add.
Buy Plan/Sell Plan
Try to open a position below $26 as possible.
If $25 breaks sell position and look to buy closer to $20.
If upside next spot where it needs to break out of $31 which is long term VPA- would look to take some profits there and see that happens
Weekly Chart
Again looks like buy/flip zone. Only thing concerning is the break below VPA which may just make it tickle down to the next volume shelf. The last few weeks./months volume did pick up which at this price level indicates buyers showing up
Monthly Chart
Again basically confirms everything in weekly
AI Info:
Financial Health and Growth:
Earnings and Revenue: Celsius Holdings reported earnings that beat analyst expectations, showing strong sales growth. The company has been expanding its market share, particularly in the energy drink sector, although there have been concerns about slower growth due to inventory adjustments with its distributor, PepsiCo.
Future Growth: The company's strategy includes international expansion and innovation in product offerings, which could drive future revenue. However, there are challenges with increased competition and the need to defend market share against giants like Monster and Red Bull.
Risks:
Market Share and Competition: Celsius has seen its market share slip slightly, with competitors gaining ground. The energy drink market is highly competitive, and Celsius needs to continue innovating to maintain and grow its market presence.
Analyst Recommendations:
Wall Street analysts have a generally bullish view on CELH. Many have given it a "Strong Buy" or "Buy" rating, with an average 12-month price target around $38.79 to $46.56, indicating significant upside potential from recent trading levels. Analysts from firms like Morgan Stanley, JP Morgan, and B.Riley have adjusted their outlook, with some lowering price targets but maintaining buy recommendations.

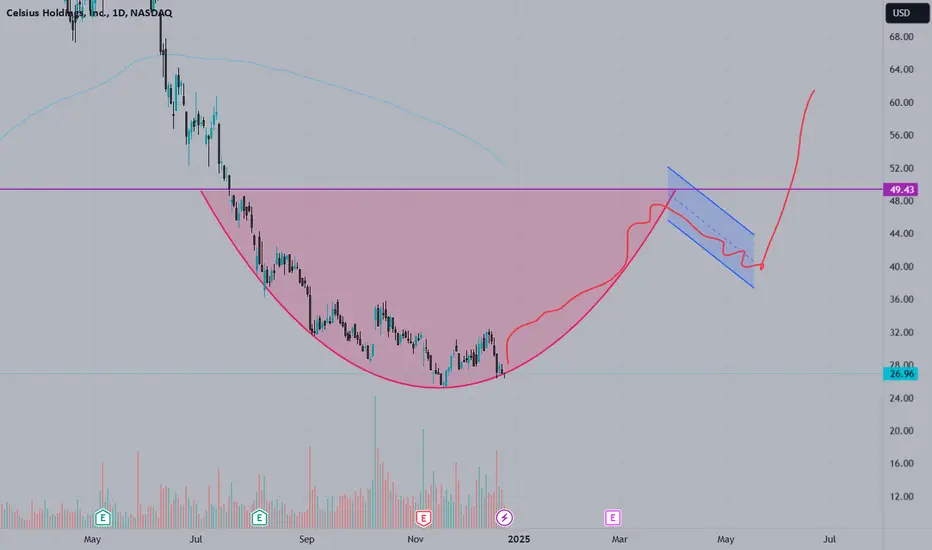
Things might be warming up for CELHCELH looks to be holding support on a rounded bottom pattern. I believe this could turn into a cup and handle which would help CELH break through a tough resistance it has faced in the past. This name has been beat up the whole year and I think it's time for it to start moving back higher.
CELH LONGRsi is showing strength as the price has been pretty stale. Rsi higher highs and higher lows. Celh price has been going sideways. IV on options is over 70% as of now. might trade shares instead of options? we will see. bullish divergence in the rsi has always been my biggest winner. Im just concerned about J powell and the market fears.

CELH - Reload opportunity?As per my last post on CELH, we built enough demand to hit our HTF supply at $32. Successful trade an outlook there. Now after an expected rejection at that HTF supply, we are back at our flip zone which was a strong resistance level now looking to turn into support. With a strong reaction off of this zone we may have another opportunity to at least retest the $32 supply and continue to attempt to break it.
Happy Trading :)

Turnaround $CELH?After long lower trend, it might be time for NASDAQ:CELH to turn around. If above 33 USD (so, not yet confirmed), anyway we will see if it manages to bounce much or it is jut a short bounce. So, risky one here and not advisable.

are u buying celcius or just drinking it. I am doing bothCELH has been drawn down since jun24. Overall the stock is showing signs of recovery. Currently trading at 30 USD. I have my buy signals active on CELh. with earning coming i thing 40 USD may come

Bottoming setup, Long $CELH for $45+- NASDAQ:CELH seems to be bottoming out and ready to rip higher.
- Haven't looked into fundamentals but technical setup looks lucrative for FY 2025 first half of the year.
- Have tried this drink in the stores and it seems to be targeting nice niche who are sugar conscious but want to enjoy a drink to relax without messing up their health.
