$LCID UP TREND TO $48/S$LCID Lucid Motors Up Trend Analysis
BREAK DOWN:
- As we see here LCID has bounced off the support line and is in up trend momentum.
- Despite seeing few RSI Divergence as shown on the graph followed by price correction, the stock is heading towards $48
- IF $LCID breaks the resistance line IT WILL CONTINUE upwards. The resistance line will now become new SUPPORT line.
KEEP AN EYE:
- On any RSI Divergence followed by price corrections to buy the stock at lower price
- The stock will break the Resistance line and continue up trend.
CH2A trade ideas

$LCID Lucid Motors RSI Divergence$LCID Lucid Motors RSI Divergence
BREAK DOWN:
- If you follow me, you know the importance of RSI Divergence.
- The chart shows a clear RSI Divergence followed by PRICE CORRECTION.
- Remember anytime there is RSI DIVERGENCE there is PRICE CORRECTION.
- Know and Learn how to find these and start seeing the price corrections happen.
- This gives you great opportunity to buy the stock at lower price.

$LCID Lucid Motors Watch$LCID Lucid Motors company technical Analysis
Lucid Motors has bounced off the Resistance @ $48
There is an RSI Divergence and stock may correct little more
WATCH:
- Currently at support after RSI correction at $48
- IF Breaks support, can short until NOV 19th
- IF Bounce off support long until NOV 19th
Watch the support line break or bounce tomorrow, Thursday Nov 11th for determination.

LCID Topping Out With RSI At 80 See BelowThis potentially great company is topping out right here on this run with a GAP unfilled in the $25 area. Not advice we are not short

One more update for this oneAs long as we are above 37.78, the count and the target for me remains the same and i am still long.

LCID updateCurrent rally to be over at $55. If you missed the ride before, don't worry we will see a pullback to $39-$43 area for the next run. No FOMO.
Note: I have been posting updates in Twitter as well. Please join me there @rbswingtrader.

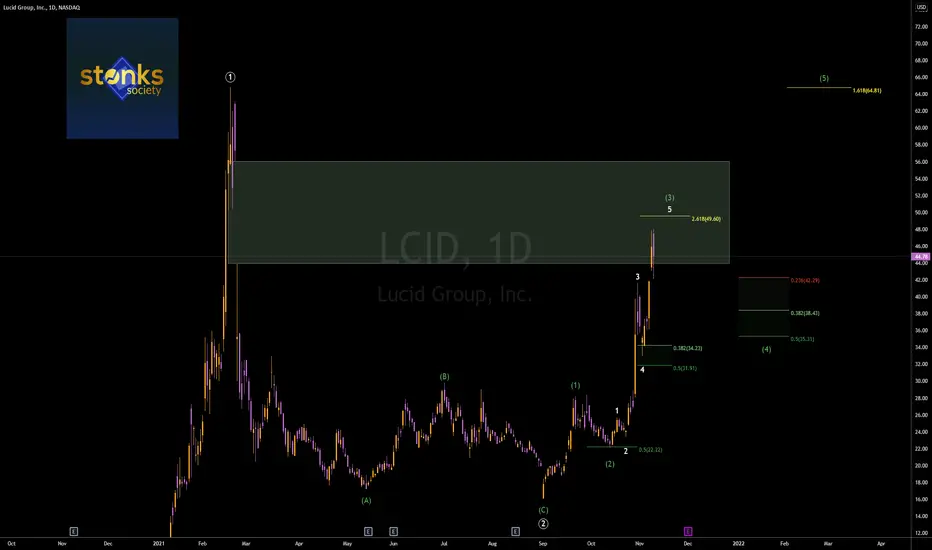
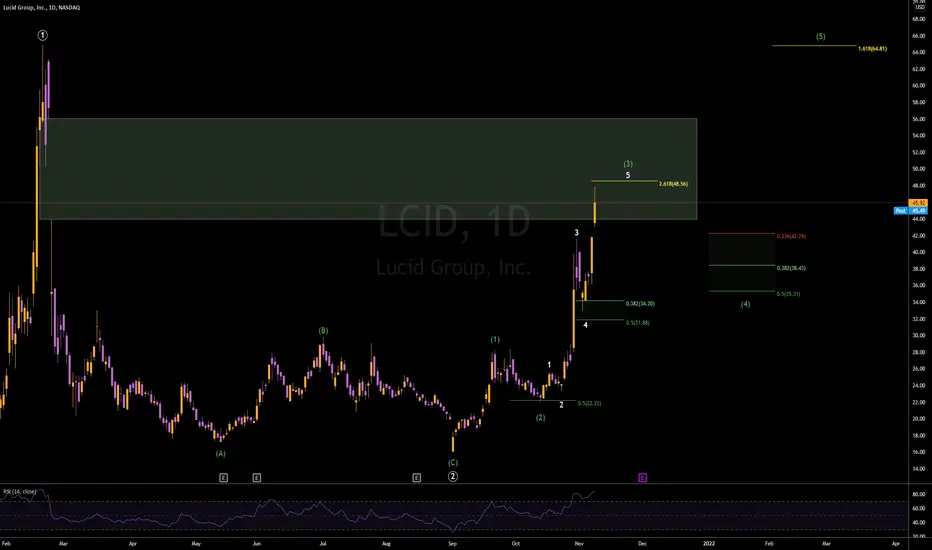
$LCID | UPDATEUpside limited from here as we conclude wave 3! Waiting for the anticipated wave 4 pullback which should be buyable. Wave 5 target is $64+!
Lucid is Pulling UpHello everyone, as we all know the market action discounts everything :)
_________________________________Make sure to Like and Follow if you like the idea_________________________________
Shares of American electric vehicle manufacturer Lucid Group Inc (NASDAQ:LCID) opened higher Monday after the company delivered its first dream edition vehicles over the weekend.
Lucid shares opened up the session at $41 and are currently priced around the $45.90 mark, up 12% from Friday's close.
The long and short-term trends are both positive. This is looking good!
A new 52 week high is currently being made by LCID, which is a very good signal! However, this is in line with the S&P500, which is also trading near new highs.
Possible Scenario for the market :
The market is looking Bullish with a good momentum the first step will be reaching the resistance line at $53.70 by the end of the week, if the stock was able to breakout that resistance then we could be seeing a further push that could drive the value of the stock up to the $64.55.
The stock has a small possibility to go into a correction move that could reach the 35.90 but no further without any updates yet.
Technical indicators show :
1) The market is above the 5 10 20 50 100 and 200 MA and EMA (Strong Bullish sign)
2) The RSI is at 84.75 and trading in the overbought zone. with no major divergences found between the indicator and the market.
3) The STOCH is at the overbought zone with a positive crossover between %K and %D.
Support & Resistance points :
support Resistance
1) 35.90 1) 44.80
2) 30.01 2) 47.81
3) 27.00 3) 53.70
Fundamental point of view :
LCID has an Altman-Z score of 10.68. This indicates that LCID is financially healthy and has little risk of bankruptcy at the moment and The Altman-Z score of LCID is much better than the industry average of 5.85.
The company hosted an owners club meeting over the weekend where members took delivery of the vehicles.
"This is a big day. We always said until we've handed cars to customers, we haven't achieved a damn thing," said Lucid's CEO Peter Rawlinson.
New owners took the vehicles through the Lucid Owners Club inaugural rally to showcase the cars' performance capabilities.
Last week, Lucid said it intends to follow the deliveries of the Air Dream edition with deliveries of its Lucid Air Grand Touring versions.
This is my personal opinion done with technical analysis of the market price and research online from Fundamental Analysts and News for The Fundamental point of view, not financial advice.
If you have any questions please ask and have a great day !!
Thank you for reading.

$LCID | WEEKLY WATCHLIST 11/8This one has been a monster recently. I personally swung calls since Friday and took my profits for a healthy gain. Sitting out until wave 4 satisfies.
Lucid Group LCID Elliot Wave Analysis Weekly ChartWelcome to a continuation of my Lucid Group analysis :)
With the help of this analysis I would like to determine the price targets of a wave 3 with the help of the Elliot wave theory.
As we can see in the weekly chart of Lucid Group, wave 1 is already formed:
0 = 02.11.2020 / 9.60 USD
1= 18.02.2021 / 64.86 USD.
This was followed by wave 2 with an ABC correction:
A = 02/18/2021 - 05/13/2021 / 17.29 USD
B = 13.05.2021 - 01.07.2021 / 29.81 USD
C = 01.07.2021 - 01.09.2021 / 16.11 USD
Wave 2 Corrected 87.27% of wave 1
I determine the possible price targets of wave 3 with the following Fibonacci extensions:
100% / 71.37 USD (pink arrow)
161.8% / 105.52 USD (purple arrow)
261.8% / 160.78 USD (White arrow)
423.6% / 250.19 USD (Blue arrow)
The height of wave 3 is ultimately dependent on the strength of the bull market.
To put it briefly, the more buying power comes up the more impulsive the wave 3 will form, because Elliot waves are based on the behavior of market participants, at least in theory.
If you take a look at the current Google Trends, you will see that the world is increasingly searched for Lucid Goup or Lucid Motors, and the search calls rise in parallel to the chart, this confirms my assumption that we are in an Elliot wave 3.
After the wave 3 is over, the price goes into a correction phase, the Elliot wave 4.
The corresponding correction wave 4 and its various price targets can be seen in the chart idea.
The correction levels are drawn in the same color as those of the wave 3
(Click on the split symbol and select "Make mine" to scroll around in the idea)
We will discuss wave 5 as soon as wave 3 and 4 are finished ;)
Because the size of wave 5, depends on wave 3 and 4.
Without these waves ( mainly wave 3 ) a projection would not make sense.
Besides the Elliot waves, I am also inspired by another pattern for further rising prices, an ABC-D.
Since ABC have formed so far, we have as a starting point the correction C of AB with 88.2%.
This results in
A-C = 0.882
As a target determination for D we draw a Fibonacci retracement from B to C, and determine the following Fibonacci levels
100% (Double Top) 64.86 USD
127.8% 78.12 USD
144% 86.31 USD
161.8% 94.98 USD
At these points, counter-movements can occur, each measured from A or C to D, correcting to the following Fibonacci Levels:
23.6%
38.2%
61.8%
127.8%
Taking into account the Elliot waves, I would consider the following Fibonacci levels as maximum correction from D:
61.8%
78.6%
88.6%
For a complete analysis description please have a look at the superior Lucid Group analysis ;) You can find it here (click on the image )
If you liked this idea, I would appreciate a click on the Like button ;)
If you have any questions, suggestions or a different opinion, don't be afraid to use the comment function.
Thanks a lot
Disclaimer:
Please keep in mind that this is a pure analysis and only reflects what my eye shows me ;)
This analysis is for informational purposes only and is scientific in nature.
This analysis is not based on any fundamental data!
This analysis is not an investment advice and should not be considered as a buy, sell or hold signal.
Always do your own research before investing and seek the advice of a qualified person.
I am not an investment advisor or similar and do not make any investment recommendation here.


LCID EXPECTATIONSHello invetors
as you see on my chart the level broken out with big volume is a signal that LCID will, after maybe a small correction, search with a big probability its TP= 37.85 and TP2= 4.0.
so be carefull the market always has raison to do everting, but we follow it when a big wave arrive.
tank you

LCID - TrendLine - Support - ResistanceWith the help of Dow theory, HL and HH are identified. The trendLine has also been drawn with joining the body of two HL.
Support and resistance levels are defined.
Buy Call at next HL (around 42).

LCID CRITICAL ZONESlcid is presenting a hight probability to reach its highest level, so keep your buyer position
lite correction can accure if rebound on 0.5 fibo level. do not worry just keep confidence on your LCID stock
good luck and don't forget make some likes and specialy follow me in order to push me doing my best

LCIDon 1W Frame
*RSI reaching over bought area
*fibonacci reaching 0.168
*no re testing yet
seems that we will have a correction to 25$

lcid long setupi have reason to believe that lucid is about to complete a little wave 2 correction here,
it was a 3-3-5 flat, rather than your usual 5-3-5 zig-zag.
what we know is, if this wave 2 was a flat - then wave 4 will be a sharp correction (so anticipate it when the time comes)
in theory what comes next in the days \ weeks ahead is a parabolic wave 3 with an upside target of $50.
there are risks to this trade, so keep a tight stop loss just below $20.50
4% risk
140% reward.
💸

Just the beginning for LCIDLong LCID over $40. Real deliveries with category leading range. Increasing volume and press coverage. Ready to rip.

LCID GAP FILL LCID looking to fill the Gap Once the gap gets tapped it shall fall through the whole gap entry around $44.30 and exit around $55.00

Lucid Starting a Run?Luicid Update: Took a LONG position at 36.33
a few days ago.
The near term Targets are there.
Looks like a lot of interest has come in, bullish
on the chart and industry. A lot of good press
on the company recently. This one may be a runner.
Maybe something for long term.

LCID IDEALcid chart : 0 as always happy trading / Keeping this a bit short as I am going to be very busy

LCID NEED TO CLOSE ABOVE $42 NASDAQ:LCID
LCID NEED TO CLOSE ABOVE $42, If not we may see it down trend to $26.

LCID GAP FILLlets watch for the LCID gap fill here, needs to keep volume up, positive news and with the EV industry staying hot this will continue.

Where to book the profitsI bought this baby back at $34 early this week per our previous post and i would be booking my profits above $52 on this (Next week most likely). Will plan to reenter later.
