AD ascending Raising Target to $170 added to position Looking at the AD, we see an Ascending Patterning (rising Money).. Looking for JPM to retest resistances level near both C and X leg where it sold off. Price Target is $170
CMC trade ideas

long term going above $180+ uptrend still in tact buy the dipslooking for another breakout set up on jpm, from a c wave buy.. buy zones $119, $143 is breakout level... but im a buyer of the dips on jpm for the long term. Notice the continuation of the upward trend (seen in the parallel channel) you can then count 2 sets of Elliott waves (which can be argued against) ..There are multiple time frames such as the 1hr, 30mi, and the 4hr time. what starts on smaller time frames leads to bigger times frames until there is an invalidation.. the uptrend is not invalidated as of yet..a breakout above 143 sets up the weekly and monthly time frame breakouts, which of course takes longer...

$JPM looking for strong second half of 2023NYSE:JPM with a strong bounce off of the monthly fair value gap on high volume. This could start to see some relative strength in the future!
Not financial advice

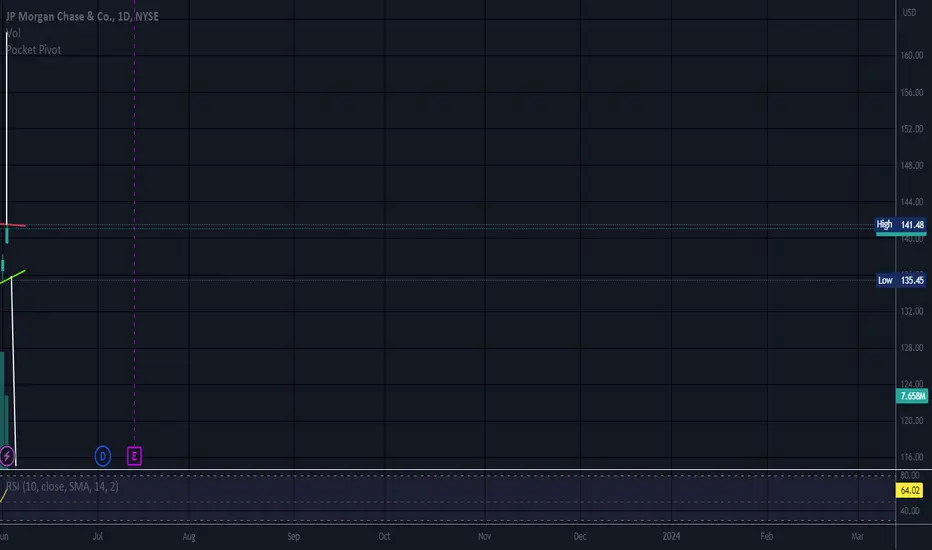
Trading JPM in current range.JPMorgan Chase - 30d expiry - We look to Buy at 134.65 (stop at 131.65)
We look to trade the current range.
This is currently an actively traded stock.
This stock has seen good sales growth.
The primary trend remains bullish.
Bespoke support is located at 134.50.
Our profit targets will be 142.15 and 144.15
Resistance: 141.50 / 143.37 / 144.34
Support: 138.13 / 136.50 / 134.50
Please be advised that the information presented on TradingView is provided to Vantage (‘Vantage Global Limited’, ‘we’) by a third-party provider (‘Signal Centre’). Please be reminded that you are solely responsible for the trading decisions on your account. There is a very high degree of risk involved in trading. Any information and/or content is intended entirely for research, educational and informational purposes only and does not constitute investment or consultation advice or investment strategy. The information is not tailored to the investment needs of any specific person and therefore does not involve a consideration of any of the investment objectives, financial situation or needs of any viewer that may receive it. Kindly also note that past performance is not a reliable indicator of future results. Actual results may differ materially from those anticipated in forward-looking or past performance statements. We assume no liability as to the accuracy or completeness of any of the information and/or content provided herein and the Company cannot be held responsible for any omission, mistake nor for any loss or damage including without limitation to any loss of profit which may arise from reliance on any information supplied by Signal Centre.

Symmetrical TriangleTop line slopes down and bottom line slopes up.
Neutral until broken
No recommendation
JPMorgan: A Wise Investment Choice Amidst Market FluctuationsOver the past few months, the stock market for banks has undergone significant fluctuations due to various factors, including interest rates, economic conditions, and notable bank failures. It's important to note that not all banks have been affected in the same manner. Despite the volatility, several major banks have adeptly navigated through these challenging times and achieved positive financial results.
One standout performer in the previous quarter was JPMorgan Chase, the largest bank in the United States. As we enter the uncertain second half of 2023, it's worth examining the position of this influential player in the industry. Investors may also be interested in determining whether this particular stock is a wise investment choice.
Even before the regional banking crisis unfolded in March, JPMorgan Chase had already distinguished itself as one of the most resilient large banks in the country. In fact, it appears that the bank may have emerged even stronger from that period of turmoil. Several key factors contribute to this assessment, which we will explore further.
First and foremost, while many banks experienced a decrease in deposits, JPMorgan Chase saw a notable 2% increase in Q1 compared to the previous quarter, bringing the total to $2.4 trillion. This growth in deposits can be attributed to concerns among customers of smaller and regional banks, who feared widespread deposit runs following the collapses of Silicon Valley and Signature banks. As a result, these customers sought refuge in larger institutions, driven by a flight towards perceived safety and stability. JPMorgan Chase, being a well-capitalized, highly liquid, and heavily regulated bank, became an attractive option for depositors seeking these qualities.
The flight to safety observed during the challenging period proved beneficial for JPMorgan Chase, resulting in a strong performance during the first quarter. The company experienced a significant 25% increase in net revenue, amounting to $39.3 billion, primarily driven by a substantial 49% year-over-year growth in net interest income. Notably, during their investor day on May 22, JPMorgan Chase's executives shared that the bank is on track to add 1.8 million accounts this year, surpassing the previous year's gain of 1.6 million accounts.
The bank's net income showed remarkable progress, rising by 52% compared to the previous year and 15% compared to the fourth quarter, reaching $12.6 billion. This growth can be attributed to positive developments in consumer banking, commercial banking, and asset and wealth management, which offset declines in investment banking. Additionally, JPMorgan Chase achieved an impressive efficiency ratio, with overhead costs as a percentage of revenue improving from 62% in Q1 of the previous year to a commendable 52%, the best performance among large banks (lower values are preferable). Moreover, the bank's overall return on equity, a measure of management efficiency, surged from 13% a year ago to 18% by the end of the first quarter.
While JPMorgan Chase may face challenges in the event of an economic slowdown or recession, it possesses key strengths that enable it to navigate short-term volatility. These strengths include operational efficiency, a high Common Equity Tier 1 ratio of 13.9%, a rising book value (up 9% year over year), and a substantial $1.4 trillion in cash and marketable securities. These factors contribute to the bank's robust balance sheet, providing resilience in difficult market conditions.
Furthermore, JPMorgan Chase is well-positioned to seize growth opportunities beyond any potential downturn. As the markets improve, the bank is expected to experience long-term gains in investment banking, trading, and asset management. Additionally, the acquisition of First Republic Bank, which serves high-net-worth clients, is anticipated to enhance JPMorgan Chase's annual profit by $500 million, acting as a catalyst for further growth.
The company also foresees greater net interest income (NII) than initially projected. JPMorgan Chase has raised its NII forecast for 2023 to $81 billion, up from the previous estimate of $80 billion. This upward revision is based on the assumption that deposit and other funding costs will decrease, driven by expected interest rate reductions by the Federal Reserve later in the year.
Furthermore, JPMorgan Chase's stock is currently trading at a relatively inexpensive price-to-earnings ratio of approximately 10. This makes it an appealing investment choice, as the bank is well-equipped to handle short-term challenges while aiming for long-term growth.
Taking everything into consideration, including its resilience, growth prospects, and favorable valuation, JPMorgan Chase appears to be an excellent buy at present, offering a combination of stability and potential for long-term gains. The bank's solid performance, strong financial position, and strategic initiatives position it favorably in the industry. However, as with any investment, it is important for investors to conduct thorough research and consider their own risk tolerance before making any decisions.

JPM possible H&S on weeklyJPM possible H&S on weekly could be a nice short opportunity, or another opportunity for MMs to get my money, whatever works for em, I'm just here for the free cookies but the banking industry ain't looking the best..

JPM 💎 TopDiamond top to kick things off next week..
Fridays price closed above 50sma.
Once price breaks the 50 , JPM should test the
200sma on the flush at 128.
As you can see 126 is an area of High support, So I think it will be a dead cat bounce there before the next leg lower.
My fib levels are
High - 172.96
Low - 50.07
If you are wondering how I got 50 for the low, you'll have to go to your monthly chart and place a horizontal bar at 50 and then you'll see years of price action there.
The diamond top target is usually the length of the diamond once the candle breaks down like so
RSI has already lost support
How I'm going to play this ?
130p
5/26
Entry - Below 50sma
Target - 126 or 200sma
Stop loss 136
I'll cover on 126 and wait for 125 to reenter short
JPM is the XLF sector leader, I don't think this banking crisis is over, regional banks are still seeing large outflows on the top of that, this Debt ceiling situation will hurt this sector the most

JP MorganCould be the END OF THE ROAD for JP Morgan...
10 year rate of change looks PRECARIOUS, just as it did back in December 2001.
#BankingCrisis #BankingSector #JPMorgan #Banks

JPM Head and Shoulders....JPM's rate of change has already been breaking down. Now, it looks like a possible head and shoulders pattern has emerged. If it breaks to the downside, look for a knees then toes pattern next! BTW, If this guy breaks down, EVERYTHING breaks down... Cant have a bull market without financials

JPM bullish move to the or notJPM looks weak. Some are saying we are going to ATH, JPM will save the banks and etc I can say only two things: I see it is forming a mega Head and Shoulder pattern and it is forming a lower high and lower low.. Therefore I can't be bullish on it in any case.
However with huge volume and strong move above the "Head" of the pattern I could say it is forming something else.

JP Morgan boss plays down risk of crisisBEARISH MID TEM
BULLISH SHORT TERM
JP Morgan boss plays down risk of crisis
THE MARKET IS FULL OF MANIPULATIONS Spoofing
Spoofing - This involves placing orders with no intention of executing them, in order to create a false impression of market demand or supply, and then cancelling the orders once the market has moved in the desired direction.
We're keeping an eye on the market makers, zooming in for a closer look."
Spoofing and Volume Point of Control (VPOC) are terms used in the context of market manipulation and market analysis in financial markets.
A spoofing detector is a tool developed to detect the spoofing of orders. Spoofing refers to a practice where a market participant places large orders to deceive other market participants and influence the price of a stock. These large orders, however, are not executed but cancelled shortly after, creating a false demand for a specific stock and influencing the price. A spoofing detector can use algorithms to detect and report these practices to maintain the integrity of the market.
The Volume Point of Control (VPOC) is a concept in technical analysis aimed at identifying the key price level at which a stock was bought and sold. VPOC is calculated by analyzing the volume data of a stock and determining the price level at which the largest volume was traded for a specific period. This price level can serve as an indicator of the current market trend and market interest in a specific stock.
There is a substantive connection between a spoofing detector and VPOC because both tools can be used to gain a better understanding of the stock markets and detect potential forms of market manipulation. For example, VPOC can be used as an indicator of potential market manipulation when an abnormal distribution of trading volume is observed at a specific price level. A spoofing detector can then be used to detect and report these activities.
Jamie Dimon, the boss of JP Morgan, has played down the risk of a spiralling banking crisis after America’s biggest bank stepped in to buy most of collapsed lender First Republic in a $10.6bn (£8.5bn) takeover hurriedly brokered by US regulators.
After weekend talks to secure a sale of First Republic, the third US lender to fail this year, the Federal Deposit Insurance Corporation (FDIC) confirmed JP Morgan as the buyer.
The regulator is providing $50bn of financing and promising to share loan losses, as part of a deal that further cements JP Morgan’s position as the largest lender in the US.
First Republic’s failure is the second largest in US banking history, beaten only by the 2008 demise of Washington Mutual – which was also seized by the FDIC and sold to JP Morgan.
Speaking on a conference call, Dimon played down any other similarities with the 2008 crash, which triggered the start of an international financial crisis that plunged the global economy into recession.
He said the US banking system was “extraordinarily sound”, adding that the takeover meant the sector was “getting near the end” of the spate of bank collapses and would “hopefully help stabilise everything”.
The failure of First Republic follows that of Silicon Valley Bank (SVB) and Signature Bank. The sequence has prompted concerns about a repeat of the contagion that characterised the global banking crisis.
Dimon said conditions were “nothing like 2008 and 2009 for a lot of different reasons”. However, he conceded that if the US economy went into recession and high interest rates persisted, that could lead to “other cracks in the system”.
Under the terms of the First Republic deal, JP Morgan will acquire all of the California-based bank’s deposits and “substantially all of the assets”, winning out over as many as five rivals reportedly in the running.
Dimon said: “Our government invited us and others to step up, and we did. This acquisition modestly benefits our company overall, it is accretive to shareholders, it helps further advance our wealth strategy, and it is complementary to our existing franchise.”
First Republic, which focused on high-net-worth clients, got into financial difficulty after customers began pulling deposits from any US lender perceived as weak, after the SVB collapse.
Growing anxiety about the health of the US banking sector has forced the Federal Reserve to launch emergency measures to stabilise the markets.
A group of 11 Wall Street banks had pumped $30bn into First Republic last month in an attempt to avoid the third bank failure of 2023. However, shares in the San Francisco-based bank fell by more than 75% last week after it revealed customers had withdrawn $100bn of deposits in March.
TREND SHORT
KEY LEVELS
119
109
87

BEFUDDLED BANKINGIt’s no secret that the US banking industry is facing some significant challenges when it comes to securities losses. In fact, the Big 4 US banks - JPMorgan Chase, Citigroup, Wells Fargo, and Bank of America - are sitting on a combined $211.5 billion in unrealized losses. That's a huge amount of money, and it's certainly cause for concern among investors and analysts alike.
One of the key reasons for these losses is the ongoing volatility in the financial markets. As we've seen over the past few years, there have been a number of factors - from geopolitical tensions to trade disputes to the COVID-19 pandemic - that have contributed to significant swings in the value of securities. For banks that hold large portfolios of these securities, these fluctuations can have a major impact on their bottom line.
Another factor that's contributing to the securities losses among US banks is the current low-interest rate environment. When interest rates are low, banks tend to invest in higher-yielding securities in order to generate returns for their shareholders. However, as we've seen in recent years, these securities can be risky, and when their values decline, it can lead to significant losses for the banks that hold them.
When it comes to regional banks, the situation is even more dire. These smaller institutions often have smaller deposit bases, which means that they have less capital to work with when it comes to investing in securities. As a result, they may take on more risk in order to generate returns for their shareholders. Unfortunately, this can backfire when the securities they've invested in experience significant declines in value.
So what does all of this mean for investors and consumers? Well, for one thing, it's important to be aware of the risks that banks are facing when it comes to securities losses. While the banking industry is generally seen as a stable and safe place to invest, the reality is that there are always risks involved. As always, it's important to do your own research and due diligence before making any investment decisions.
For consumers, it's important to be aware of the financial health of the banks where you keep your money. While the FDIC provides insurance for deposits up to $250,000 per account, it's still a good idea to make sure that the bank you're working with is financially stable and secure. Doing so can help to protect your money and ensure that you have access to the services and resources that you need.


JP Morgan GOT NOTHING on gold!JP Morgan GOT NOTHING on gold!
Check out those dates... VERY BULLISH for precious metals.
#gold #JPMorgan #silver #BankingCrisis

JPMorgan Chase ($JPM) Calls Ahead of Analyst DayGoldman Trade Idea: "Buy JPM Calls ahead of Analyst Day"
Goldman's Richard Ramsden highlights JPM’s ability to gain share of deposit balances during macro volatility in Mar’23, continued favorable deposit betas, robust-and-improving capital ratios along with a
commitment to capital returns demonstrate the franchisee’s strength positioning it well for through-cycle returns and growth.
Analyst Day = 5/22/23
JPM 5/26 139C @ < $2.30 (Buying at discount; JPM Entry = 3.57)
Target = 145


JPM likely consolidation before the final drop JPM did drop out of the rising wedge and once again show how rising wedge and falling wedge are very powerful patterns, I would say the most powerful trading patterns. JPM needs to consolidate a little bit more before the next move. For bears would be best to consolidate for several more days above BigRed and then start to drop like a stone below it. For bulls I can't say anything, I believe there are not many bulls as people should understand how big a problem this is.
JPM is forming a low base now right at BigRed. Break below it would be considered as the low base is triggered and a new short position would occur.
RSI is not oversold yet so there is still some room to drop.
MACD is showing some signs of life but it will be enough just for consolidation.
Good luck everyone.

$JPM with a bullish outlook following its earnings #StocksThe PEAD projected a bullish outlook for NYSE:JPM after a positive over reaction following its earnings release placing the stock in drift A with an expected accuracy of 71.43%.


JPM: Dimon's diamond effectEPS at all time High, Stock waiting to catch up.
The intrinsic value of one JPM stock under the base case scenario is 185.05 USD. Compared to the current market price of 141.7 USD, JPMorgan Chase & Co is undervalued by 23%.

JP Morgan Priced in PlatinumJP Morgan (priced in platinum) carving out a MASSIVE top.
VERY bullish for #gold #silver #oil and #uranium.
You have been warned.
#BankingCrisis #Platinum

Trade Review: 2% Crash @ Market OpenThe problem is that the market crashed
down by 2% right at market open for NYSE:JPM
--
If you where using high margin of x10 you
would have experienced a -20% on
--
Your options trading account
--
This is why i tell you to not use margin
--
When i am sharing this information i am
assuming you are a beginner
--
Remember do your own research before you
trade am not an expert
--
Faithfully,
Lubosiforex
