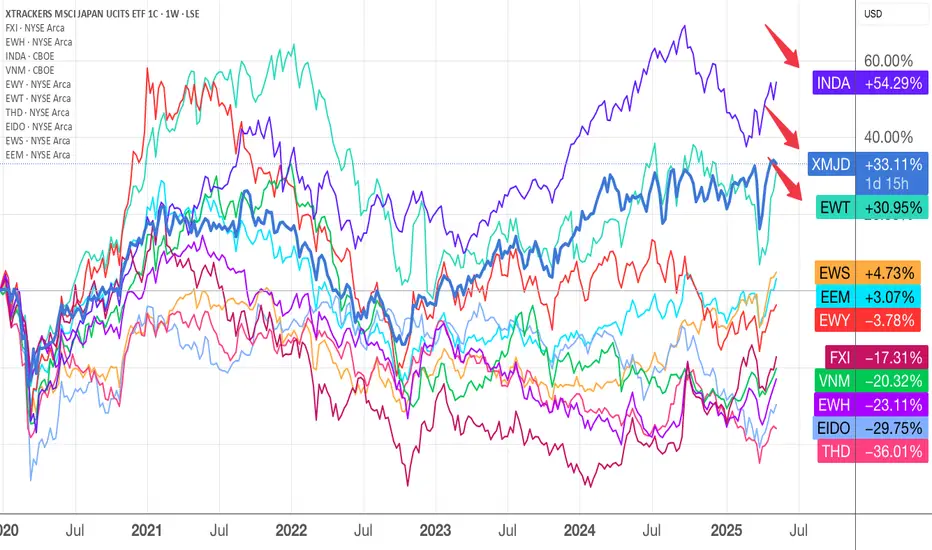
Going for the trees and not the forest in AsiaAsia is big and have many countries with different population size, economic growth, cycles and strong and weak sectors. A quick look at this chart reveals the top 3 countries ETF that you would have made better returns than the SPX would be the India, Japan and Taiwan ETFs.
Is that why WB is so k
Key stats
About XTRACKERS
Home page
Inception date
Jan 9, 2007
Structure
Luxembourg SICAV
Replication method
Physical
Dividend treatment
Capitalizes
Primary advisor
DWS Investment SA
ISIN
LU0274209740
The aim is for your investment to reflect the performance of the MSCI Total Return Net Japan Index (the Reference Index) which is designed to reflect the performance of the shares of certain companies in Japan.
Classification
What's in the fund
Exposure type
Finance
Producer Manufacturing
Electronic Technology
Consumer Durables
Stock breakdown by region
Top 10 holdings
Bullish Outlook on Japan Stocks!Notice the bullish formation drawing on the Japanese stock market on the weekly timeframe! An up breakout will confirm it's time to ride this bull. But there's more! Don't forget the big picture. The Nikkei 225 is close to breaking its all-time highs from 1989, which would be a massively bullish sig

See all ideas
Summarizing what the indicators are suggesting.
Oscillators
Neutral
SellBuy
Strong sellStrong buy
Strong sellSellNeutralBuyStrong buy
Oscillators
Neutral
SellBuy
Strong sellStrong buy
Strong sellSellNeutralBuyStrong buy
Summary
Neutral
SellBuy
Strong sellStrong buy
Strong sellSellNeutralBuyStrong buy
Summary
Neutral
SellBuy
Strong sellStrong buy
Strong sellSellNeutralBuyStrong buy
Summary
Neutral
SellBuy
Strong sellStrong buy
Strong sellSellNeutralBuyStrong buy
Moving Averages
Neutral
SellBuy
Strong sellStrong buy
Strong sellSellNeutralBuyStrong buy
Moving Averages
Neutral
SellBuy
Strong sellStrong buy
Strong sellSellNeutralBuyStrong buy
Displays a symbol's price movements over previous years to identify recurring trends.
Related funds
Frequently Asked Questions
An exchange-traded fund (ETF) is a collection of assets (stocks, bonds, commodities, etc.) that track an underlying index and can be bought on an exchange like individual stocks.
DBXJ trades at 71.363 CHF today, its price has risen 3.08% in the past 24 hours. Track more dynamics on DBXJ price chart.
DBXJ net asset value is 72.49 today — it's risen 6.80% over the past month. NAV represents the total value of the fund's assets less liabilities and serves as a gauge of the fund's performance.
DBXJ assets under management is 2.13 B CHF. AUM is an important metric as it reflects the fund's size and can serve as a gauge of how successful the fund is in attracting investors, which, in its turn, can influence decision-making.
DBXJ price has risen by 4.55% over the last month, and its yearly performance shows a −1.21% decrease. See more dynamics on DBXJ price chart.
NAV returns, another gauge of an ETF dynamics, showed a −4.37% decrease in three-month performance and has decreased by −1.91% in a year.
NAV returns, another gauge of an ETF dynamics, showed a −4.37% decrease in three-month performance and has decreased by −1.91% in a year.
Since ETFs work like an individual stock, they can be bought and sold on exchanges (e.g. NASDAQ, NYSE, EURONEXT). As it happens with stocks, you need to select a brokerage to access trading. Explore our list of available brokers to find the one to help execute your strategies. Don't forget to do your research before getting to trading. Explore ETFs metrics in our ETF screener to find a reliable opportunity.
DBXJ invests in stocks. See more details in our Analysis section.
DBXJ expense ratio is 0.20%. It's an important metric for helping traders understand the fund's operating costs relative to assets and how expensive it would be to hold the fund.
No, DBXJ isn't leveraged, meaning it doesn't use borrowings or financial derivatives to magnify the performance of the underlying assets or index it follows.
In some ways, ETFs are safe investments, but in a broader sense, they're not safer than any other asset, so it's crucial to analyze a fund before investing. But if your research gives a vague answer, you can always refer to technical analysis.
Today, DBXJ technical analysis shows the buy rating and its 1-week rating is strong buy. Since market conditions are prone to changes, it's worth looking a bit further into the future — according to the 1-month rating DBXJ shows the neutral signal. See more of DBXJ technicals for a more comprehensive analysis.
Today, DBXJ technical analysis shows the buy rating and its 1-week rating is strong buy. Since market conditions are prone to changes, it's worth looking a bit further into the future — according to the 1-month rating DBXJ shows the neutral signal. See more of DBXJ technicals for a more comprehensive analysis.
No, DBXJ doesn't pay dividends to its holders.
DBXJ trades at a premium (0.24%).
Premium/discount to NAV expresses the difference between the ETF’s price and its NAV value. A positive percentage indicates a premium, meaning the ETF trades at a higher price than the calculated NAV. Conversely, a negative percentage indicates a discount, suggesting the ETF trades at a lower price than NAV.
Premium/discount to NAV expresses the difference between the ETF’s price and its NAV value. A positive percentage indicates a premium, meaning the ETF trades at a higher price than the calculated NAV. Conversely, a negative percentage indicates a discount, suggesting the ETF trades at a lower price than NAV.
DBXJ shares are issued by Deutsche Bank AG
DBXJ follows the MSCI Japan. ETFs usually track some benchmark seeking to replicate its performance and guide asset selection and objectives.
The fund started trading on Jan 9, 2007.
The fund's management style is passive, meaning it's aiming to replicate the performance of the underlying index by holding assets in the same proportions as the index. The goal is to match the index's returns.