FMC1 trade ideas

ShortThe stock has broken through the support level and there is no sign of a reversal. In this connection there is a possibility of shorting to the nearest level.
❤️ If you find this helpful and want more FREE forecasts in TradingView
. . . . . Please show your support back,
. . . . . . . . Hit the 👍 LIKE button,
. . . . . . . . . . . Drop some feedback below in the comment!
❤️ Your Support is very much 🙏 appreciated!❤️
💎 Want us to help you become a better Stock trader?
Now, It's your turn!
Be sure to leave a comment let us know how do you see this opportunity and forecast

Ford's Rent is DueThe RSI is showing a clear bearish divergence on the RSI. As we see on the daily, there are three lower highs on the RSI combined with higher highs in price action. This is bearish. We also see overextensions on the weekly and monthly RSI. Moving averages have not been catching up which suggests there will at least be a correction to them and they will be tested as support levels. Volume indicates that Ford is going to tank though because there is a high amount of selling pressure at these levels. Even though Ford is green, earnings are around the corner and my guess is that even if there is a beat there will nonetheless be a tank. Any good news has been priced in. Bad news would tank the stock even more. In short, RSI suggests a major downtrend beginning shortly. Volume spikes support this idea. Moving averages also suggest a correction is coming. Ford has failed to overcome a 24.95 price level as well on the shorter timeframes. Let's also remember how overextended the broader market is and how tethered it has become to the indexes doing well. All of the indexes have been recovering a little bit but that does not mean Ford will do well. DYODD. This is only my idea not financial advice.
Also: this is pretty much just TA. I did not look at Ford's financials but I imagine they're not doing great because most car companies are not very good financially. Demand for cars is probably not going to be good. There's too much hype in the auto space and the cost to transition to EVs will be immense. Tesla did not just switch the lights on and neither will Ford.
I anticipate a bounce at a large consolidation level. That is the horizontal line.

$F Potential (Bullish?) on 4HR Flat Bottom or Triple Bottom Potential Flat Bottom or Triple Bottom Chart Pattern for Ford.
I think this will be bullish IMO looking at the chart and the open interest despite the news.
Which one do you think it is? What are your thoughts?
Thanks,
Kelly :)

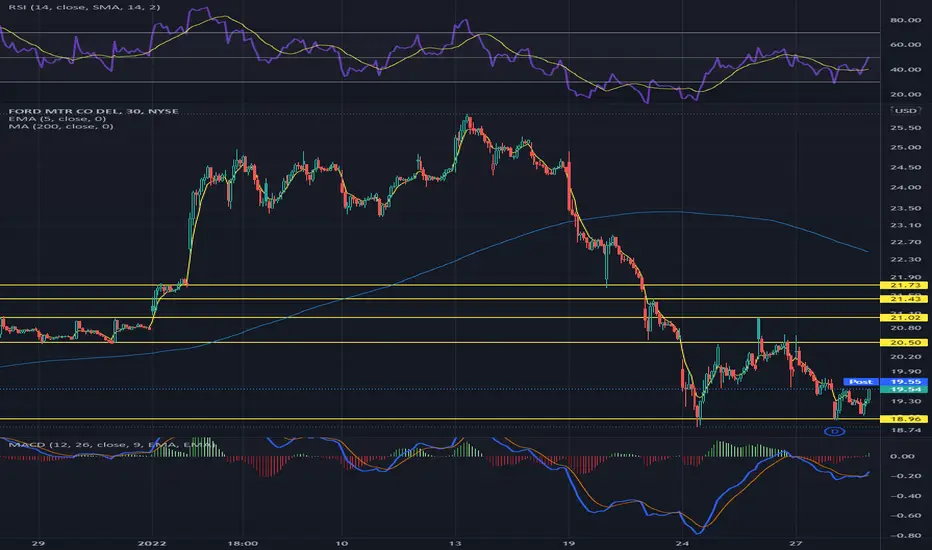
Ford Also Driving Lower?Ford - Short Term - We look to Sell at 19.84 (stop at 21.31)
Preferred trade is to sell into rallies. Closed above the 20-day MA. The medium term bias remains bearish. Previous support, now becomes resistance at 20.00.
Our profit targets will be 16.17 and 13.62
Resistance: 20.00 / 25.00 / 30.00
Support: 16.00 / 12.50 / 10.00
Disclaimer – Saxo Bank Group. Please be reminded – you alone are responsible for your trading – both gains and losses. There is a very high degree of risk involved in trading. The technical analysis, like any and all indicators, strategies, columns, articles and other features accessible on/though this site (including those from Signal Centre) are for informational purposes only and should not be construed as investment advice by you. Such technical analysis are believed to be obtained from sources believed to be reliable, but not warrant their respective completeness or accuracy, or warrant any results from the use of the information. Your use of the technical analysis, as would also your use of any and all mentioned indicators, strategies, columns, articles and all other features, is entirely at your own risk and it is your sole responsibility to evaluate the accuracy, completeness and usefulness (including suitability) of the information. You should assess the risk of any trade with your financial adviser and make your own independent decision(s) regarding any tradable products which may be the subject matter of the technical analysis or any of the said indicators, strategies, columns, articles and all other features.
Please also be reminded that if despite the above, any of the said technical analysis (or any of the said indicators, strategies, columns, articles and other features accessible on/through this site) is found to be advisory or a recommendation; and not merely informational in nature, the same is in any event provided with the intention of being for general circulation and availability only. As such it is not intended to and does not form part of any offer or recommendation directed at you specifically, or have any regard to the investment objectives, financial situation or needs of yourself or any other specific person. Before committing to a trade or investment therefore, please seek advice from a financial or other professional adviser regarding the suitability of the product for you and (where available) read the relevant product offer/description documents, including the risk disclosures. If you do not wish to seek such financial advice, please still exercise your mind and consider carefully whether the product is suitable for you because you alone remain responsible for your trading – both gains and losses.

$F Ford - 20 Year Resistance has been confirmed as Support.$F was shallacked today on disappointing numbers. On weekly chart former resistance held as support despite the selling pressure. I actually like F long as long as this support level holds.

Ford (F) -- Clockwork.Hello everyone,
Ford has repeatedly made local tops, dropped a slight bit, overextended itself past the prior local top (by about 20-25%), and come down to retest the prior local top 3 times since Fall of 2020. After each of these retests, Ford has proceeded to make an extremely bullish move of 40%+. Given the recent 55%+ move made by Ford and its habits of retesting previous local tops in the last year, a pullback to around $16 and subsequent bounce of approximately 50% to reach a target of $25 seems exceedingly likely, if not inevitable. This is of course conditioned on the market continuing to remain relatively bullish, as well as Ford's ability to continue to improve their company's outlook, which the current CEO has demonstrated he is capable of doing.
The outlook for Ford is extremely bullish over the long term and buying this stock (which has not made an all-time high since the 1990s!) at any level under $20 is an opportunity, even with the continual bullish move since 2020. Watch this space.
All the best,
Jason

Ford is Breaking Out!Ford is breaking out! I bought some $13 Calls a week or two ago for .07 a contract and am currently up over 600%.
On this weekly chart you can see the breakout from a long bear trend. I am experimenting with the harmonics so let me know where I messed up, but I'm think I'm pretty close and that this is a valid projection. My target for Ford is $21.90 by August 2024 lol.
On the 4hr you can see the gap that I think will fill as we back test support. If this happens I will look to add to my current position and open some new positions with a longer expiry.
I am LONG Ford! Owhoooo!

Long term BUY!!!!!buy buy buy and thank me later
like this post and comment and lets see what happen in the next weeks

Weekly $ from Ford wheelsTraders who don't think Ford Motor is headed to oblivion could try writing some weekly puts just OTM, and then writing calls when / if assigned. High implied volatility could make this a good play if $F bounces around 18 for a while.

F back in the box .. for nowDrop post market after earnings miss
Dip gets bought up and MMs put the ticker back in trading range
Possible Wyckoff Dist pattern still in play

Ford has some downside aheadFord has a gap to fill at 15.92 and a massive head and shoulders that coincides with even lower targets but first things first. Any short positions should be long term as there can be natural retracements up along the way down.

What comes first? $15 or $25?Ford testing a breakout of a long term supply/consolidation zone
Possible resistance line turned support
Choppy price action above current zone
Bull gap below 16.55-15.92 at MA200
Earnings after market 2/3
Has correlated with SPY often
ATR on 1d is 1.09
Neutral for now - trading contracts not holding stock just yet

Ford Looking ready for new all time highs. Daily chart on Ford is looking pretty bullish to me. Combine the chart setup with earnings on Thursday and with pre orders of their evs soldout i expect ford to beat earnings and give a good guidance heading into the next few quarters. MACD looks about ready to close red and turn green, while RSI is heading up. GM had earnings which were mixed but not bad in my opinion. Ford has been my winner during the past few months with the market being in red. Im giving Ford a 30 dollar price target. Long term price target of 50 dollars.

$FORD will buy me a FordIntersection incoming on the 1D
Still trading in range
Gap and support much lower than current SP
10 day pump to HIGH 25.69 - lossed all gains 5 trading days later
Possible trend lines for Bullish and Bearish movement
Gap and support much lower than current SP
Has followed SPY closely

$F POSSIBLE BREAK OUT FORMINGif $F can break the 19.50 resistance I'm thinking we see it jump to $20.50 - 21. What are your thoughts?
$F - Extremely critical that $19 holdFord is currently at a critical support after breaking down. $19 is a critical area of support and breaking it below could send the stock to $15.34 area and fill the gap.
$19 is also the 50% fib retracement area in leg up. Ford's earning is next week and it could decide 15.34 or $22.70.
If you look at the time series on the trend line check backs, the price is over due to touch back on long term trend line around $17ish area.
Breaking below $19 support would be the indicator that it will trend lower.
Bearish target 1 - $17 - $18
Bearish target 2 - $15.34
Bull case - Bounce from $19.
———————————————————
How to read my charts?
- Matching color trend lines shows the pattern. Sometimes a chart can have multiple patterns. Each pattern will have matching color trend lines.
- The yellow horizontal lines shows support and resistance areas.
- Fib lines also shows support and resistance areas.
- The dotted white lines shows price projection for breakout or breakdown target.
Disclaimer: Do your own DD. Not an investment advice.

$F 1/11/2022Daily chart analysis
$F. Ford was in an Accumulation Phase which lasted close to 18 years.
In Nov. 2021, it broke out from Accumulation phase and then proceed to enter a flag pattern. This is the start to Ford Uptrend.
From there, price went on to break the out of the bull flag and continue uptrend. Price is currently respecting all EMAs including 10.
This is my cue to enter. Will look at lower time frame for entry
1HR Chart analysis
Currently in uptrend.
Price has been bouncing between 24.80 and 23.50.
Price is currently at support area of 23.50
Price is currently at Dynamic support level of 50ema
Stochastic is currently at oversold.
Will enter trade and go long
Entry: 23.80
Stop loss: 22.50
Target: trail 10 ema on daily chart

$F 1/11/2022Daily chart analysis
$F. Ford was in an Accumulation Phase which lasted close to 18 years.
In Nov. 2021, it broke out from Accumulation phase and then proceed to enter a flag pattern. This is the start to Ford Uptrend.
From there, price went on to break the out of the bull flag and continue uptrend. Price is currently respecting all EMAs including 10.
This is my cue to enter. Will look at lower time frame for entry
1HR Chart analysis
Currently in uptrend.
Price has been bouncing between 24.80 and 23.50.
Price is currently at support area of 23.50
Price is currently at Dynamic support level of 50ema
Stochastic is currently at oversold.
Will enter trade long
Entry: 23.80
Stop loss: 22.50
Target: trail 10 ema on daily chart


Swing Trade Idea on FordSo hear me out. Ford filled a gap back down to the 21ish area on Friday and briefly broke through a support level just under 21 before the day ended. I see this thing continuing down to test the next support just above 19 this week. To add gas to the flame the dividend is also happening this week which will slightly add to the drop which might even take us down to 18. However, shortly after that we have earnings coming out. Ford, in the last 6 earnings releases, has absolutely obliterated the EPS estimate by +$0.24, +$0.16, +$0.73, +$0.41, +$0.43, and +$0.95 respectively. This, obviously, caused large spikes after every earnings release usually around the several dollar range.
My plan, in regards to all this, is to hold puts (which I bought early on Friday) through the dividend, then close those and pick up some far out calls to hold through earnings and beyond, since fundamentally I'm still bullish on Ford as a company over the long term.
I am, by no means, a trading expert. I am more so asking for tips and advice for this. Does anyone else like this idea? Am I way off? Anybody else want to try this with me?
Good luck this week!

Ford for the next week 🐻If spy opens up green for the week We may see it sitting around 442 helping ford bounce back too the 21-21.5 levels. We could also see spy keep falling into 430 levels being supported from the last 7 months taking ford back to the 20-19 range. If spy continues to fall past 430 ford will most likely break out the strong support it had from November to January. Feeling bearing on this next week.

$F — SHORTFord has had an epic rally lately but it is simply overbought at these levels so I am expecting a slight pullback.
Nothing major, just a small pullback.
