$CRM Ascending Wedge Reversal trade$CRM has a pretty clean looking Ascending Wedge Reversal pattern forming on the daily. Could push only slightly higher and will breakdown as the wedge tightens imo.
FOO trade ideas

CRM LONG Street Raises 1.3% New High TargetMorgan Stanley raises Salesforce's (NYSE:CRM) target from $216 to $225, saying the company is "ready to yield" on recent investments.
CRM is on an upward trend plus the news of MS raising the price target will have investors buying shares up


CRM— nearing temp end of the climb??After a strong climb since dec31,2019 — after 3 weeks it is now it is near the top of the channel and showing signs of a temporary pullback (possibly.) Might be time to Take off some profits and buy back in, possible—If momemtum trader. Lets see the next days events....
Overall a strong buy rating with 7% upside still to go on big picture views. Strong analyst support given, for buy and hold investors. High price target of $216 by analysts views. Average is $196.40

$CRM Breakout to All-Time HighToday we're looking at Salesforce.com on the 1W chart as price has consolidated into an ascending triangle. Over the past week price has broken through the horizontal resistance around $166 with a very strong weekly candle.
This ascending triangle has a price target of around $214.25 but we may see a small pullback before continuation.
If we see a pullback I expect price to find support on the horizontal chart pattern boundary around $166.
If you would like to see more of these ideas on a regular basis, follow me as I will be posting many more exciting chances to earn on chart pattern breakouts this upcoming year!
Drop a like or comment if you found this idea informational or helpful in any way!
Cheers!


Sale the ForceHi traders
SalesForce on the move
here with a possibale CRAB pattern
Entry here should be around D point
short.
around price 180
Lets wait and see

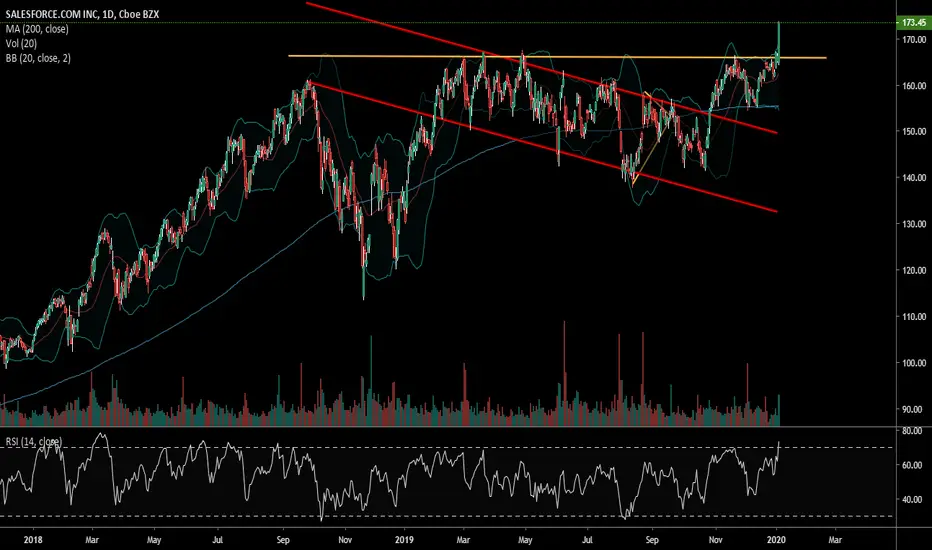
Trade the breakout in SalesforceSalesforce has finally joined the rally today and had a very convincing breakout from a long term congestion channel.

CRM, Nice upside to ATH breakoutDisclaimer: not financial advice.
The last earnings established a nice support (green rectangle) and prevented another swing to the downside of -2.0 Standard Deviations (the lowest blue line).
I think we are straddling a few nice lines that will make for a good move real soon.
The gray rectangle is where we have All Time Highs (ATHs). This has been a safe resistance/selling area in the past. Eyeballs are on this line.
As described in earlier paragraph, the last ER generated the green trend line of support. This was an important area of support because it also came at the -1.0 Stdev area. In fact, we did not even break it. The most predictable move was probably to the downside and there was enough strength to reverse that trend.
I like to clone Bar Patterns from past scenarios that looked similar. The red bars were taken from January 2019 when CRM broke to the upside and the red-dotted line (Linear Regression, 500days) became Support. I like how this bar pattern matches up nicely to some resistance at +1.0 Stdevs and support at the green line.
The bar pattern also runs up to the +2.0 Stdevs line right at the next Earnings. I would say there's a lot more risk to the downside at that date but perhaps something like a Straddle into earnings would make sense.
I also like to watch the Fisher Transform and Stochastics for some confirmation. These both look like they do not want to exit their "overbought" territories, perhaps extending a run upwards.
It feels like a breakout of ATH would be imminent and if so would create a nice squeeze up.

Salesforce.com Had a Cup and Handle. Is a Breakout Next?Salesforce.com is a classic growth stock, with high multiples but also steady expansion of its products over time. It's exactly the kind of company cited by William O'Neil in How to Make Money in Stocks .
That classic trading book teaches readers about the "cup and handle" pattern that often occurs in secular-growth stocks. It's a high basing formation following a big rally. O'Neil's technique is to watch for smaller pullbacks to produce a tighter range, looking for a potential breakout to new highs.
CRM may have that potential setup now -- especially when you look at the October low (above $140) versus the August low (around $138). That was followed by another higher low at the 200-day simple moving average (SMA) around $156. A "golden cross" pattern occurred around the same time in early December.
CRM's fundamentals have been solid, with strong results the last two quarters and the potential for synergies after acquiring Tableau Software. CRM is also on pace for a bullish outside week (higher high and lower low), plus its highest weekly close ever.

Long Idea - Software name2/Jan/2020 01:05 PM AUTHOR: Brandon Gum
--
Software space is doing well right now. - So if there is more upside here is an idea.
Due to it being a breakout strategy, 25% will be taken on day 5 of breakout per Thomas Bulkoski's breakout data showing most retrace/fail after day 5.
======================

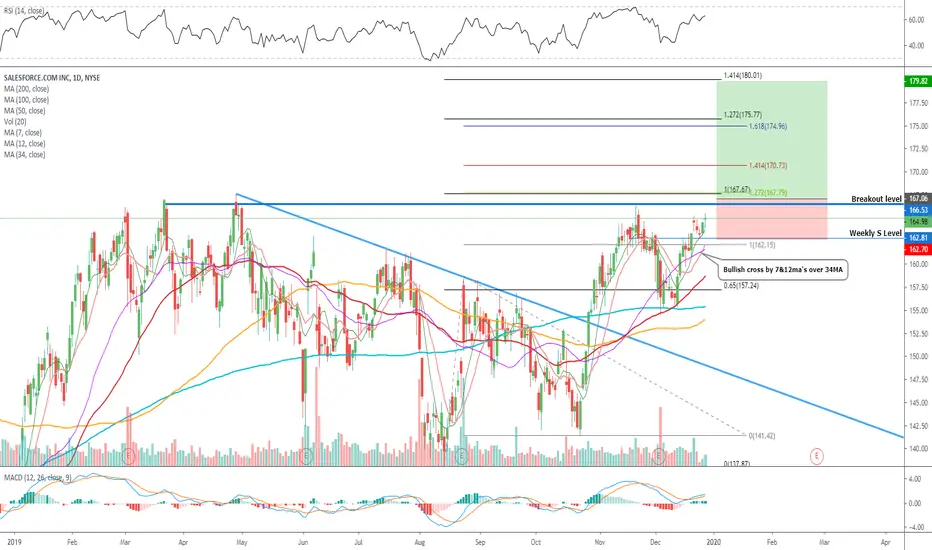
$CRM Salesforce approaching breakout Entry level $167.00 = Target price $180 = Stop loss $162.70
Indicators are bullish as is the moving averages having recently completed a golden cross and a bullish cross by the 7&12mas's over the ma34.
salesforce.com, inc. engages in the design and development of cloud-based enterprise software for customer relationship management. Its solutions include sales force automation, customer service and support, marketing automation, digital commerce, community management, collaboration, industry-specific solutions, and salesforce platform. The firm also provides guidance, support, training, and advisory services. The company was founded by Marc Russell Benioff, Parker Harris, David Moellenhoff, and Frank Dominguez in February 1999 and is headquartered in San Francisco, CA.
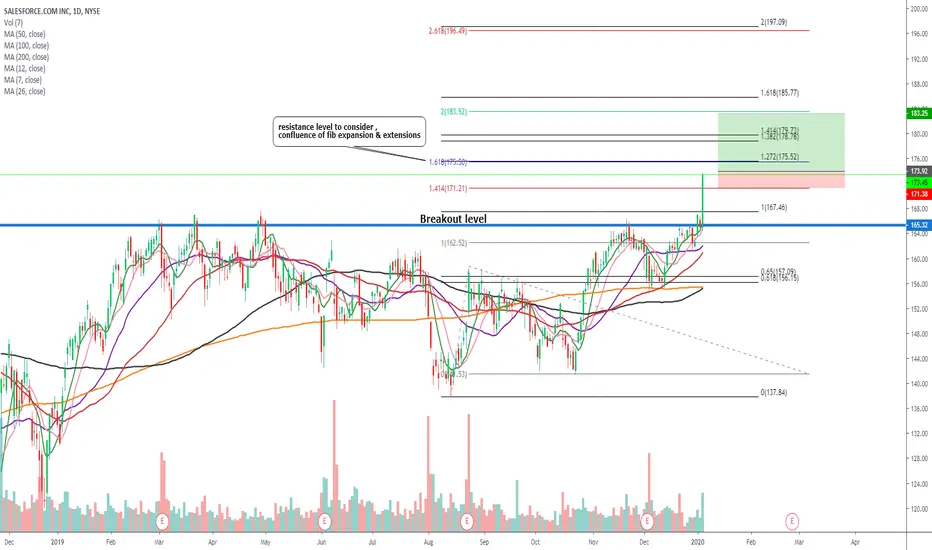
Overhead Resistance BreakoutOverhead resitance breakout would herald a continuation of long term uptrend hence basis for good entry point.

$CRM Bearish Shooting star with volume targeting 158.5Bearish shooting star candlesticks pattern . Next following candle expected to be long red or other small doji then drop . Its more likely to pullback to 0.62 fib at 158.5 from current level at 164.6


CRM - possible long swing trade as $SPX pushes higherSalesforce has twice before made strong 100% moves, after breaking of 2+ years of sideways range consolidations. These moves coincided with the $SPX breaking out higher in 2012 and late 2016.
Watching for a CRM monthly close above $165.35 and hold above that level for possible start of third run up. Another equal 100% move target would be just above $330.


CRM - SALESFORCE - SHORT SETUP USING PUTSMETHOD: Short SALESFORCE {price at entry 156.40} via :
+2 CRM 20 DEC 19 160 PUT @4.40 ; Trading with 0.75 of extrinsic value, well in the money.
STRATEGIES: Using CRM day chart :
The 20/50 Mean started a crossing downward pattern, and we can look for a new red cloud to form for a short.
The Fisher Transform bounce signal has failed and is now showing a continuation short near a critical support price.
TACTICS: The plan in terms of stock price :
STOP is price > 160
TGT1 153 scale; TGT2 148.75 to exit
Trail option price to Break Even once stock price < 154; OR consider scaling as red cloud becomes large
You may let the Fisher Transform and 20/50 mean together take you out technically for whatever you get win or lose.
Will update in comments,
B3
d^.^b

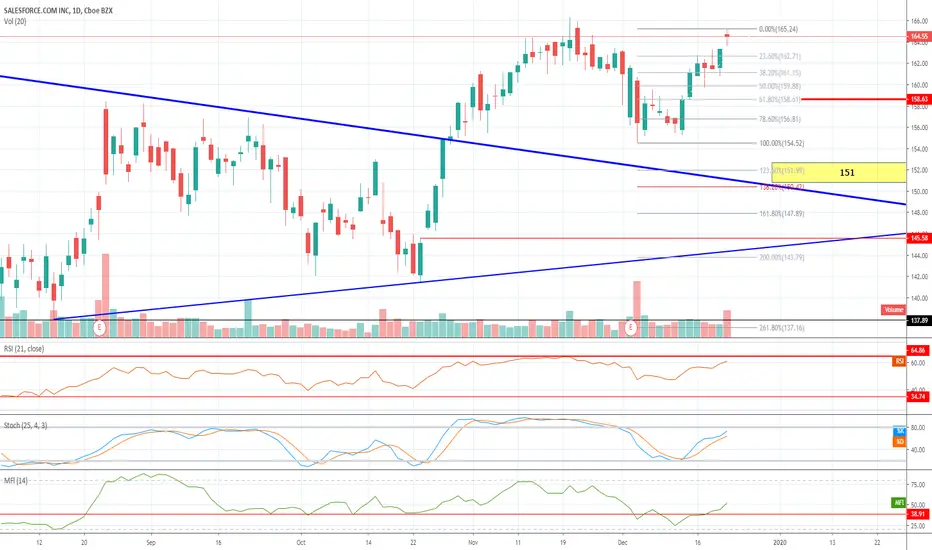
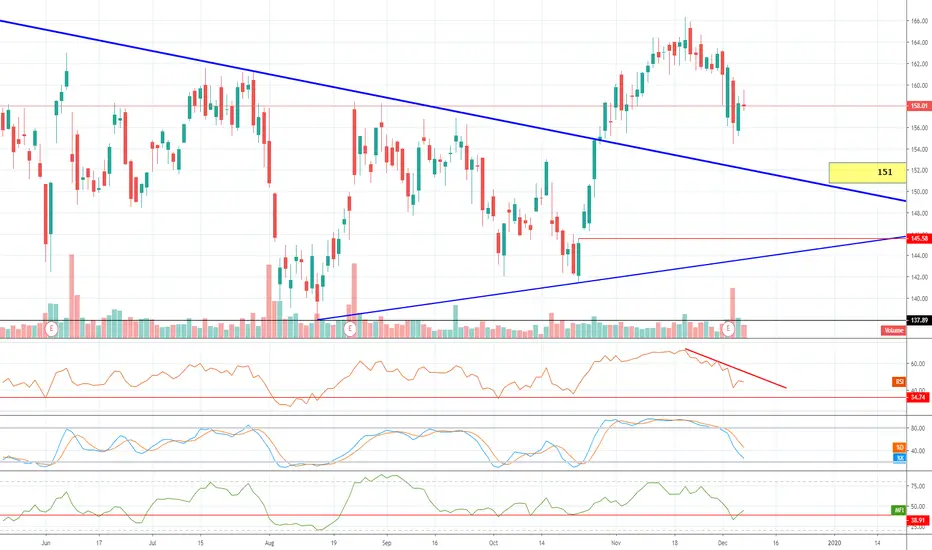
$CRM Bearish pattern targeting 151.8-145.5 Showing identical topCRM dropped almost 5% from recent top (166.3) to (154.5) But still showing more weakness with indicators suggested further decline to 151.8 then bounce or continue drop to 145.5 (correction by 10%) then starts brand new uptrend from there but for now remain bearish targeting new support . Best short entry from 161
CRM on strong resistance but watch out for earnings report!SHORT - CRM
SL: 166.46 (Suggested by our algorithmic system)
TP: 156.15 (Suggested by our algorithmic system)
Reasons behind this idea:
1. Bearish divergence on OBV, Accumulation/Distribution and MACD
2. Price on strong resistance level
CAUTION: Earning report is due in a few days!
---------- Chart Drawings ----------
Blue Dotted Line: Broken Support Trendline
Red Dotted Line: Broken Resistance Trendline
Blue Solid Line: Support Trendline
Red Solid Line: Resistance Trendline
Blue Rectangle Box: Support Level
Red Rectangle Box: Resistance Level
Blue Arrow Line: Bullish Divergence
Red Arrow Line: Bearish Divergence
Purple Vertical Line: Suggested Stoploss by our algorithmic system
Green Vertical Line: Suggested Stoploss by our algorithmic system
Trade idea from our mobile app: ibb.co (Timestamp is in Australian Sydney Time UTC+7)
Please trade responsibly and good luck!
