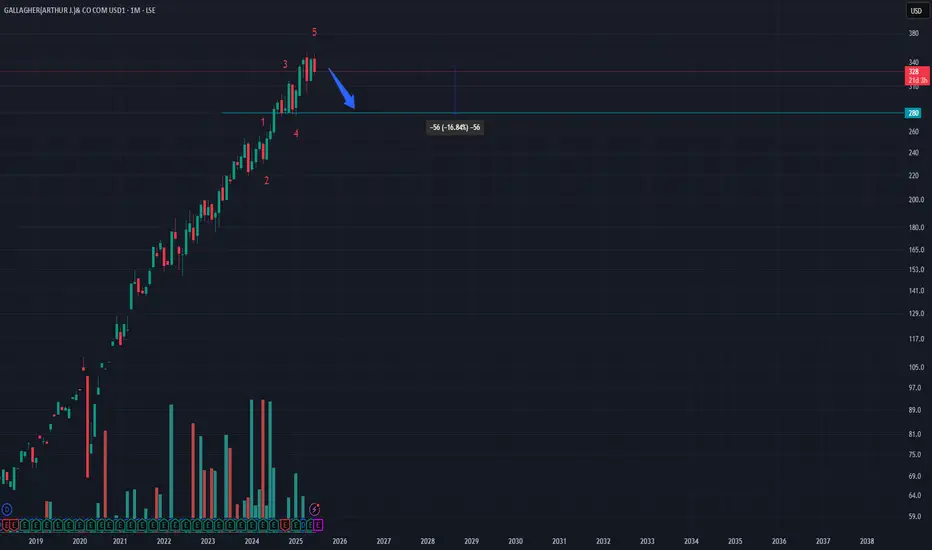
GALLAGHER (AJG) – Completed Impulse Wave Could Break the UptrendThe chart shows a fully completed 5-wave impulse structure at the top. This signals a potential break in the prevailing uptrend. The risk of a correction has increased, with a likely minimum pullback of around 15%, targeting the $280 level.
Price action around the trendline and previous wave 4 supp
Next report date
—
Report period
—
EPS estimate
—
Revenue estimate
—
5.866 CHF
1.33 B CHF
10.49 B CHF
253.37 M
About Arthur J. Gallagher & Co.
Sector
Industry
CEO
Patrick J. Gallagher
Website
Headquarters
Rolling Meadows
Founded
2016
FIGI
BBG00LVD8653
Arthur J. Gallagher & Co. engages in the provision of insurance brokerage, reinsurance brokerage, consulting, and third-party claims settlement and administration services. It operates through the following segments: Brokerage, Risk Management, and Corporate. The Brokerage segment consists of retail and wholesale insurance brokerage operations. The Risk Management segment provides contract claim settlement and administration services. The Corporate segment manages clean energy and other investments. The company was founded by Arthur J. Gallagher in 1927 and is headquartered in Rolling Meadows, IL.
Arthur J. Gallagher (AJG) TP-$291 SL-$297Technical Analysis:
-Extremely strong resistance (equilibrium zone on the monthly chart)
-Pattern of change in movement on the daily chart and a double top in lower timeframes, thus there is an alignment of readings
-Strong equilibrium points above $290, which act as technical magnets
Indicators:


AJG: Entry, Volume, Target, StopEntry: with price above 219.23
Volume: with volume greater than 955k
Target: 243.31 area (this is an area, no guarantee it reaches this price, but you should be selling on the way up)
Stop: Depending on your risk tolerance; Based on an entry of 219.24, 207.22 gets you 2/1 Reward to Risk Ratio

$AJG with a Bullish outlook following its earnings #Stocks The PEAD projected a Bullish outlook for $AJG after a Positive over reaction following its earnings release placing the stock in drift B with an expected accuracy of 50%.
$AJG with a Bullish outlook following its earnings #Stocks The PEAD projected a Bullish outlook for $AJG after a Positive over reaction following its earnings release placing the stock in drift B with an expected accuracy of 33.33%.

Bearish Rising WedgeAJG has weathered the down turn in the market very well so far. Price is sitting above the .236 of the trend up.
Price is in side a Rising Wedge that is not valid until the bottom trendline is broken. This can be a long term pattern, but I have noted these usually break in a more timely manner sin

AJG Looks Like a near-term buy right here.AJG is completing a nicely-formed buying point. We are looking for the next day in which the close is likely to be above the open. Let's watch this one with a buy reference point of today's close.

Is $AJG making the handle to its cup?Notes:
I last spoke about this on July 26, 2022 and since then gone up but came back down erasing almost all of the gains. If you didn't take profits earlier on its gap up that's okay as it seems like $AJG may be making the handle to its cup. Keep an eye on the $170 area as it should hold as suppo

$AJG is coming up on the right side of its base!Notes:
* Very strong up trend on all time frames
* Great earnings track record
* Basing for the past ~7 months
* Offering a very low risk entry
* Recently saw a retest of its 50 day line
* Held up really well while the general market and the Financial sector where taking a beating
Technicals:
S

See all ideas
An aggregate view of professional's ratings.
Neutral
SellBuy
Strong sellStrong buy
Strong sellSellNeutralBuyStrong buy
Neutral
SellBuy
Strong sellStrong buy
Strong sellSellNeutralBuyStrong buy
Neutral
SellBuy
Strong sellStrong buy
Strong sellSellNeutralBuyStrong buy
Displays a symbol's price movements over previous years to identify recurring trends.
AJGG5295094
Arthur J. Gallagher & Co. 3.05% 09-MAR-2052Yield to maturity
7.26%
Maturity date
Mar 9, 2052
AJG5185137
Arthur J. Gallagher & Co. 3.5% 20-MAY-2051Yield to maturity
6.93%
Maturity date
May 20, 2051
AJGG5959041
Arthur J. Gallagher & Co. 5.55% 15-FEB-2055Yield to maturity
6.06%
Maturity date
Feb 15, 2055
AJGG5548694
Arthur J. Gallagher & Co. 5.75% 02-MAR-2053Yield to maturity
6.04%
Maturity date
Mar 2, 2053
AJGG5752563
Arthur J. Gallagher & Co. 5.75% 15-JUL-2054Yield to maturity
6.03%
Maturity date
Jul 15, 2054
AJGG5677782
Arthur J. Gallagher & Co. 6.75% 15-FEB-2054Yield to maturity
5.84%
Maturity date
Feb 15, 2054
AJGG5959040
Arthur J. Gallagher & Co. 5.15% 15-FEB-2035Yield to maturity
5.30%
Maturity date
Feb 15, 2035
AJGG5752562
Arthur J. Gallagher & Co. 5.45% 15-JUL-2034Yield to maturity
5.20%
Maturity date
Jul 15, 2034
AJGG5295093
Arthur J. Gallagher & Co. 2.4% 09-NOV-2031Yield to maturity
5.15%
Maturity date
Nov 9, 2031
AJGG5548693
Arthur J. Gallagher & Co. 5.5% 02-MAR-2033Yield to maturity
5.15%
Maturity date
Mar 2, 2033
AJGG5677781
Arthur J. Gallagher & Co. 6.5% 15-FEB-2034Yield to maturity
5.12%
Maturity date
Feb 15, 2034
See all GAH bonds
Curated watchlists where GAH is featured.

Related stocks
Frequently Asked Questions
The current price of GAH is 257.894 CHF — it has decreased by −8.76% in the past 24 hours. Watch GALLAGHER AJ &CO stock price performance more closely on the chart.
Depending on the exchange, the stock ticker may vary. For instance, on BX exchange GALLAGHER AJ &CO stocks are traded under the ticker GAH.
GAH stock has fallen by −8.76% compared to the previous week, the month change is a −1.81% fall, over the last year GALLAGHER AJ &CO has showed a 5.90% increase.
We've gathered analysts' opinions on GALLAGHER AJ &CO future price: according to them, GAH price has a max estimate of 318.64 CHF and a min estimate of 235.70 CHF. Watch GAH chart and read a more detailed GALLAGHER AJ &CO stock forecast: see what analysts think of GALLAGHER AJ &CO and suggest that you do with its stocks.
GAH stock is 9.60% volatile and has beta coefficient of 0.36. Track GALLAGHER AJ &CO stock price on the chart and check out the list of the most volatile stocks — is GALLAGHER AJ &CO there?
Today GALLAGHER AJ &CO has the market capitalization of 64.97 B, it has increased by 1.04% over the last week.
Yes, you can track GALLAGHER AJ &CO financials in yearly and quarterly reports right on TradingView.
GALLAGHER AJ &CO is going to release the next earnings report on Jul 24, 2025. Keep track of upcoming events with our Earnings Calendar.
GAH earnings for the last quarter are 3.25 CHF per share, whereas the estimation was 3.16 CHF resulting in a 2.92% surprise. The estimated earnings for the next quarter are 1.93 CHF per share. See more details about GALLAGHER AJ &CO earnings.
GALLAGHER AJ &CO revenue for the last quarter amounts to 3.27 B CHF, despite the estimated figure of 3.28 B CHF. In the next quarter, revenue is expected to reach 2.60 B CHF.
GAH net income for the last quarter is 623.57 M CHF, while the quarter before that showed 234.59 M CHF of net income which accounts for 165.81% change. Track more GALLAGHER AJ &CO financial stats to get the full picture.
Yes, GAH dividends are paid quarterly. The last dividend per share was 0.53 CHF. As of today, Dividend Yield (TTM)% is 0.78%. Tracking GALLAGHER AJ &CO dividends might help you take more informed decisions.
GALLAGHER AJ &CO dividend yield was 0.85% in 2024, and payout ratio reached 36.92%. The year before the numbers were 0.98% and 49.76% correspondingly. See high-dividend stocks and find more opportunities for your portfolio.
As of Jun 13, 2025, the company has 56 K employees. See our rating of the largest employees — is GALLAGHER AJ &CO on this list?
EBITDA measures a company's operating performance, its growth signifies an improvement in the efficiency of a company. GALLAGHER AJ &CO EBITDA is 2.98 B CHF, and current EBITDA margin is 27.04%. See more stats in GALLAGHER AJ &CO financial statements.
Like other stocks, GAH shares are traded on stock exchanges, e.g. Nasdaq, Nyse, Euronext, and the easiest way to buy them is through an online stock broker. To do this, you need to open an account and follow a broker's procedures, then start trading. You can trade GALLAGHER AJ &CO stock right from TradingView charts — choose your broker and connect to your account.