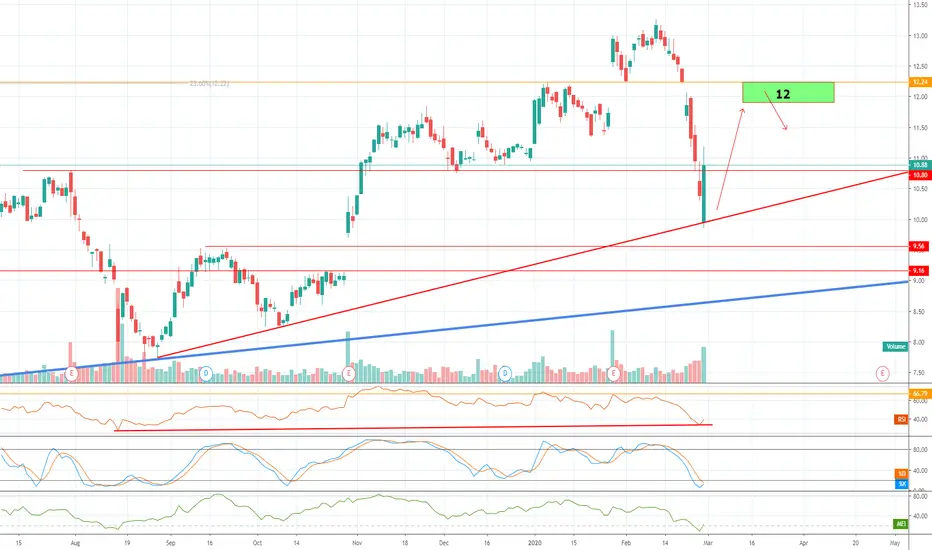
$GE Bullish candle with higher volume targeting 12 LONG Still showing positive long-term bullish trend , Friday candle was good enough to support up trend started on Sep-2019 with target at 12 then possible pullback to confirm support and continuous moving up . Closing above 12 for 2-3 days will lead for new high 2020 at 15.3
GEC trade ideas

GE COULD BE INTERESTINGNot sure where its heading, good for long term play, load up when the tide is low. Plus you can never go wrong with GE.
Good luck.


GE LONG 1DFor the time the company seems to recover.Last earnings were good but it is weighted down from Boeing and the General Market movement that looks like a correction.
1.breakout from mirror level
2.RSI is borderline overbought so I believe we may see some more correction to 11.5-12
3.On the 61.8 fibbo level
TP:16.8 SL:10.7 R/R is ok .
Good luck

General Electric - contrarian buy?NYSE:GE is not the stock you probably want to own given all the heat experienced by the company recently.
But from contrarian perspective, nice levels right now to attempt speculative buy. Price retraced by 61.8% of previous bounce and is holding the line of previous resistance. Today may be the third daily candle when 7.8 is held, indicating that good support zone might be formed at around current levels.
Trade: stop at 6.39 (previous low), target at ~13$


GE Elliott Wave Pattern Spotting (long)GE:
I have zoomed out to the supercycle level on a weekly and the general path is towards $25 zone (unless we completely get out of this pattern).
Some things I've noticed looking over the large patterns:
1. Large corrections lasted 2 years
2. Wave 2 and 4 alternate from the previous set meaning:
Look at: 2003 - 2007 upswing pattern (notice waves 2 and 4), Then look at the upswing pattern from 2009 - 2016, compare wave 2 and wave 4 of a larger degree to 2003-2007 then 2018 to present compare that to 2009 and 2016. Obviously realize that there are 2-year corrective patterns between them. But we have alternated the waves so if 03-07 started with Wave 2 sharp, look at the 09-16 and you'll see wave 2 went sideways. I have seen this many times on bullish moves so my point is, when people look for entry or exist points and want to predict a bit what the wave pattern might do, how far it will correct or increase...zooming out has always worked for me.
If you're good at spotting patterns, you'll be able to see opportunities.
GE is a very slow-moving stock so I swing trade it. It will fill a few gaps: $11 and $8 but there's also a gap in the 25s and between 32.40-34.73 that hasn't been filled yet so I say we'll head to 35 before massive correction.
This is just an overall analysis, I confirm direction by counting waves, using a few indicators, looking at my favorite analysts on youtube and tradingview. I'm not a financial pro and only trade for myself, it's been working well. I have learned stock trading by trading BTC as the systems run Elliott Wave pattern so it's identical only 24/7, if you want to learn fast, go trade BTC.
If you have other ideas, please share!

The waveThis is what the wave looks like for anyone interested from my last post. This will help you new traders understand the different kinds of trends a market can take on. Dont over complicate it. If your not trending nicely then go find something else to trade. This is GE and is a good example of an uptrend. We have the green bars and the wave is slanted up at a 12-2 clock angle.. This is raghee horners tool..i take no credit for making it..ive just learned how to use it.

GENERAL ELECTRIC (GE): Close To Supply Zone
General Electric is very close to a decent area of supply.
looking left at structure we can see how the underlined area was significant for the market participants in the past.
+ rsi has reached the overbought condition and we haven't seen a bearish reaction on this stock since summer 2019.
good luck!

GENERAL ELECTRIC (GE) Weekly ChartDates in the future with the highest probability for price direction reversals

GE: Bearish signal confirming resistance levelA long resistance level (back in Nov 2018) holds again and the stock is confirming this with a bearish engulfing pattern.
Don't like the window below (potential resistance) but at least I can enter with a very tight stop.

GE Double Bottom GE on the higher time frame formed a double bottom I expect the market to go back up at least to the down trend line

Bumbling fumbling.P/e Value of 648...? How does that even happen.. Share price is 3 dollars off historic lows.

GE MAKING MOVESNot an advisor, 5 months of trading experience. I would love some feedback.
Good luck fellas!

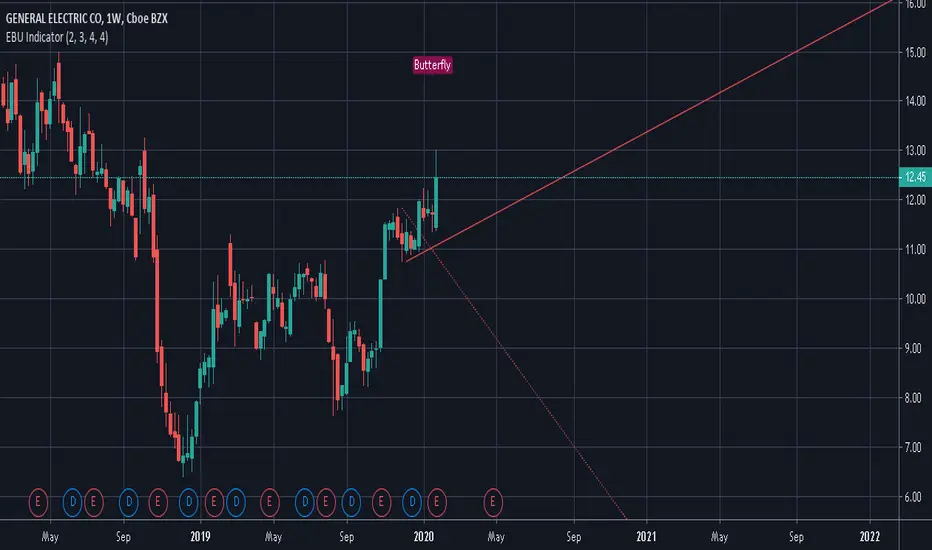
GE has a bearish butterfly patternGE has a bearish butterfly pattern. Wait for the breakout. NYSE:GE
Bollinger BandsAn analysis utilizing the bollinger bands indicator. The price overtook the moving average and rose up to just above the top band.

GE in its first Bull Trend channel in years.Doing this analysis and I have zero stake in this stock. But I am about to.
Price broke out of the range.
Golden cross on the daily.
The 55 SMA is moving right along with the bottom trend channel.
Bright days ahead for this stock.

GE just like the old GNew year, new me, new G...E the turn around is coming for the company, and Boeing's new 777 plane will look to be a great addition to $GE bottom line. Good breakouts and some solid higher highs are being made in this one.
uc out

Potential Big upside push after next earnings (29th)Last 3 quarters have been in profit for this company. Chart looks like a good long if it can maintain support.

GE - Still Chugging Along!GE is up premarket on a strong earnings report. Although guidance for this year came down a bit, cash flows are projected to be better than expected. Management is committed to turning things around and keeping the momentum going. Premarket the stock is trading around $12.50-$12.70. This is above the outlined channel and should be the push that gets the stock to $13.30. This is a name that I am adding to on any pullback. Need to monitor the situation with the 737 MAX. GE did say that their projections are based on the Max resuming flights this summer.

Future path for GE?Is a rebrand in store for GE when we start using wireless electricity? Look up Zenneck Waves and companies like VIZIV and Zenneck Power. There is already an operational tower in Milford, TX. I'm sure GE will become involved in this tech if they wish to remain an industry powerhouse for centuries to come.

General Electric: New Bull Cycle starting.GE is on Higher Highs on the 1W chart for the first time since August 2016. That was the last peak before a strong 2 year bear cycle hit the company. As you see on the chart General Electric's trend is a parabolic Channel starting with the All Time Highs in 2000. This long term curve has entered its asymptotic phase and may initiate the recovery back to the ATH.
At this stage however we choose to focus on the next Bull Cycle which based on the following parameters is about to start:
* As mentioned Higher Highs on 1W.
* RSI on a Channel Up.
* Long term support at 5.50 holding.
A Golden Cross will simply confirm the new Bull Cycle. We are still in the early stages, GE is an excellent long term investment for your portfolio.
Our Target Zone is 28.00 - 32.00.
** If you like our free content follow our profile (www.tradingview.com) to get more daily ideas. **
Comments and likes are greatly appreciated.
