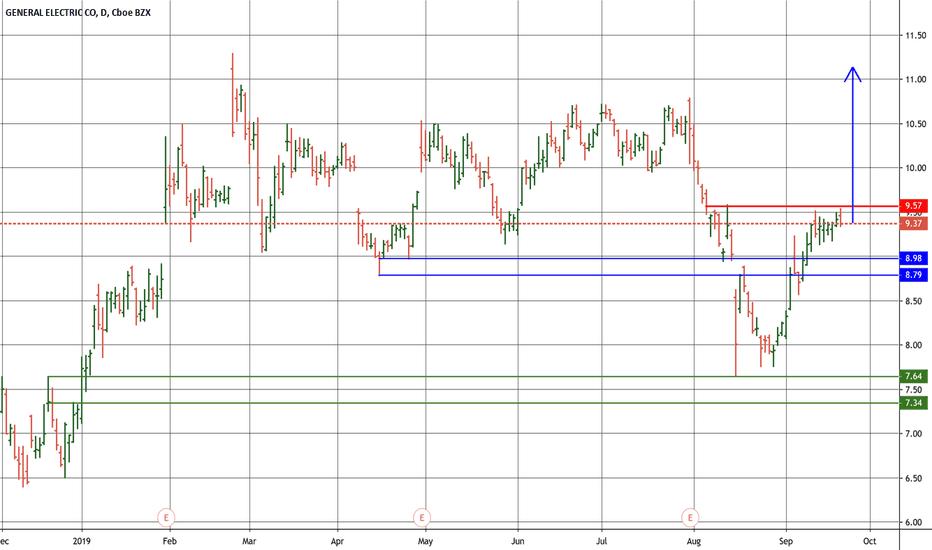
GEC trade ideas
Moving average here we can see a moving average of 18 ( red line ) and a exponential moving average of 9 ( black line ) in 30 minutes in General electric stocks . it was a good opportunity for a short operation , because we can see that the exponential moving average of 9 is bellow the moving average of 18 ( a death cross ) .
Head And Shoulders GE stockIn the next chart we are getting an upper trend which follows to the beginning of the head and shoulders pattern. The second the trend line break at point A and gets an upper trend again, could mean the double top pattern or a head and shoulders pattern. As soon as the trend changes and changes but it doesn't touch the resistance line we can appreciate at point B it starting to form the ''head'' of the pattern making a higher high on the chart providing enough information to continue our pattern Then we place our strategy and wait.
$GE Looking Better Technically and Fundamentally$GE is now trading above its 200-day moving average and has made a series of higher lows. After a solid quarterly earnings report and improved Free Cash Flow, $GE looks much better from a fundamental and technical perspective. If $GE closes above the 200- day moving average, we believe institutions will start coming back into the stock. We think new 52 week highs could be come sooner rather than later considering many had written $GE off.
As always, trade with caution and use protective stops.
Good luck to all!
GE WeeklyGE is poised to make a nice bull run. They've made a habit over the years of slowly climbing then crashing down. This is no different. They went from a high of about 27.50 to 6.40 in a matter of about 18 months. With a trend of higher lows over the last few weeks, we can anticipate GE will start making a run back up.
was it...As GE Goes So Goes the Nation? ....im just thinking GE might break out from this level and move up a good bit. As i thought about it i realize the equities are back up to high levels. So im thinking maybe GE and the broader markets will all breakout together.
comments pro or con always welcome
GE - Down TrendLooking at GE towards a downtrend towards 8 which was the previous low in mid Aug. The top Green bar shows where previous support has turned to resistance. The next possible support is marked by the green rectangle box.
Further, ADX shows a climb above the 20 level and shows that the bears are in control for the moment.
GE ... just thinking out loudGuidelines
• Impulse wave subdivide into 5 waves. In Figure 2, the impulse move is subdivided as 1, 2, 3, 4, 5in minor degree
• Wave 1, 3, and 5 subdivision are impulse. The subdivision in this case is ((i)), ((ii)), ((iii)), ((iv)), and ((v)) in minute degree.
• Wave 2 can’t retrace more than the beginning of wave 1
• Wave 3 can not be the shortest wave of the three impulse waves, namely wave 1, 3, and 5
• Wave 4 does not overlap with the price territory of wave 1
• Wave 5 needs to end with momentum divergence


