GILD Gilead Sciences Options Ahead of EarningsIf you haven`t bought GILD before the previous earnings:
Then analyzing the options chain and the chart patterns of GILD Gilead Sciences prior to the earnings report this week,
I would consider purchasing the 80usd strike price Calls with
an expiration date of 2024-6-21,
for a premium of approximately $3.10.
If these options prove to be profitable prior to the earnings release, I would sell at least half of them.
GIS trade ideas

Gilead's Trodelvy Faces Setback in Lung Cancer Trial
In a recent announcement, Gilead Sciences ( NASDAQ:GILD ) disclosed disappointing results from a late-stage trial evaluating its antibody-drug conjugate, Trodelvy, in second-line treatment for advanced non-small cell lung cancer (NSCLC). The Phase 3 study, aiming to expand Trodelvy's applications, did not meet its primary goal of significantly improving survival for previously treated patients. Despite a noted three-month survival benefit for a subgroup, the overall outcome fell short of statistical significance. This setback raises questions about Trodelvy's potential in lung cancer and underscores the challenges in developing effective treatments for this complex disease.
The Trial and Its Implications:
The trial involved 603 patients with metastatic or advanced NSCLC who had experienced disease progression despite standard platinum-based chemotherapy and checkpoint inhibitor treatment. Gilead reported that patients receiving Trodelvy exhibited longer survival compared to those on chemotherapy, but the difference did not reach statistical significance. Notably, a subgroup of patients who did not respond to their last checkpoint inhibitor treatment showed a more than three-month survival benefit. Gilead plans to discuss these results with regulators and present the full data at an upcoming medical meeting, indicating a commitment to transparent communication and a thorough examination of the findings.
Exploring Trodelvy's Potential:
Despite the setback, Gilead ( NASDAQ:GILD ) remains optimistic about Trodelvy's potential in metastatic NSCLC. The company emphasizes the drug's positive impact on a specific patient subgroup and expresses confidence in Trodelvy's broader lung cancer clinical development program. Gilead's Chief Medical Officer, Merdad Parsey, highlights ongoing Phase 2 and 3 trials investigating Trodelvy in combination with Keytruda as an initial treatment for NSCLC patients. The company's dedication to understanding the drug's effects and exploring potential pathways reflects a commitment to advancing cancer care.
Trodelvy's Safety Profile and Current Approvals:
Gilead ( NASDAQ:GILD ) reassures stakeholders by affirming that Trodelvy's safety profile aligns with prior studies, with common adverse events being neutropenia (low white blood cell counts) and diarrhea. It's worth noting that Trodelvy is already approved by U.S. regulators for specific advanced breast cancer and bladder cancer indications. In the first nine months of the previous year, Gilead reported sales of $765 million for Trodelvy, attesting to its commercial success in the approved indications.
Future Prospects and Challenges:
Despite the setback in the second-line lung cancer trial, Gilead remains resilient in its pursuit of innovative solutions for oncology. The ongoing front-line Phase 3 trial combining Trodelvy with Keytruda suggests a strategic focus on exploring novel treatment approaches. However, as emphasized by Parsey, results from this trial are not expected for at least a couple of years, highlighting the prolonged timeline inherent in clinical research.
Conclusion:
Gilead's ( NASDAQ:GILD ) recent trial results for Trodelvy in second-line NSCLC treatment present a nuanced narrative of challenges and opportunities in the evolving landscape of cancer therapeutics. The company's commitment to transparency, ongoing research, and exploration of combination therapies underscores the complexity of addressing lung cancer, one of the most formidable challenges in oncology.
As the full dataset becomes available and discussions with regulators unfold, stakeholders will eagerly anticipate the next chapter in Trodelvy's journey, hoping for breakthroughs that could reshape the future of lung cancer treatment.

GILD 6-Year Resistance IdeaGILD is pushing a 6-year resistance line. It broke through for a few days a year ago before being battered back down. Let's see if it'll make the move stick this time.

GILD: $69 | another Breakthrough for Humanity | Loaded!from Ebola treatment to quick remedy for Corona
truly a mission worth funding and risking on

Stocks pairs trading: AMGN vs GILDIn the biotechnology sector, the differing financial metrics and market positions of Amgen Inc. (AMGN) and Gilead Sciences Inc. (GILD) present an interesting case for investors. It could be strategic to consider buying AMGN while contemplating selling GILD based on their respective financial performances and market dynamics.
Reasons to Prefer AMGN Over GILD:
Earnings Per Share (EPS): AMGN's EPS of $14.06 is significantly higher than GILD's $4.66. This higher EPS indicates better profitability and efficiency in AMGN's operations compared to GILD.
Market Capitalization: AMGN’s market capitalization is $142.36 billion, which is much larger than GILD’s $94.36 billion. A higher market cap often suggests stronger market presence and investor confidence.
Return on Equity (ROE): AMGN shows an exceptional ROE of 133.80%, far outpacing GILD's ROE of 27.08%. This indicates that AMGN is more efficient in converting shareholder investments into profits.
Year-to-Date Performance: AMGN’s year-to-date performance shows a positive change of 1.28%, in contrast to GILD’s -11.79%. This suggests that AMGN has been performing better in the current market environment.
Decision:
Buy 1 AMGN: For its stability, reasonable valuation, and balance between income and growth potential.
Sell 3 GILD: Considering the comparative underperformance and potential challenges in growth and market position.

Long Rubles Big PharmaAs you can see on the presented chart first goes Gilead Sciences, USA Pharmaceutical Giant which we see as the main sorce of income and R&D of USA Pharmaceuticals Industry. Main levels are 82.50, 79.00, 73.50, 69.00. Second is Pfizer, Europe Pharmaceutical giant, main levels are 54.50, 46.50, 28.50. Third is Merck, based, again, in Europe, main levels are 115.00, 80.50. Fourth is Bayer, a multinational Pharmaceutical Giant. Fifth is Life, biopharm company from Russia, main levels are, 9.00, 7.25, 4.70. Sixth is Diod, experimental and natural medicine company, main levels are 24.00, 15.50.
We see a possibility of strong profits in coming quarters, due to the winter season and new R&D activities. Wee see these companies as a good opportunity for a risk oriented investor to hold for about twelve to twenty four months.

GILD - Setting up for multi year run
Monthly chart is setting up nicely.
if it takes out 88, ATH should be quick.
stop loss: 79

GILD Gilead Sciences Options Ahead of EarningsIf you haven`t bought GILD on the Remdesivir approval:
Then analyzing the options chain and the chart patterns of GILD Gilead Sciences prior to the earnings report this week,
I would consider purchasing the 80usd strike price in the money Calls with
an expiration date of 2024-1-19,
for a premium of approximately $4.25.
If these options prove to be profitable prior to the earnings release, I would sell at least half of them.
Looking forward to read your opinion about it.

GILD Short This trade has multiple patterns on M15, and it is with the trend. All timeframes are overbought and have divergence, this trade should be able to fall to the bottom and maybe even more as it is hitting the H4 moving average and has the strength to fall especially with the news regarding Isreal as of now.

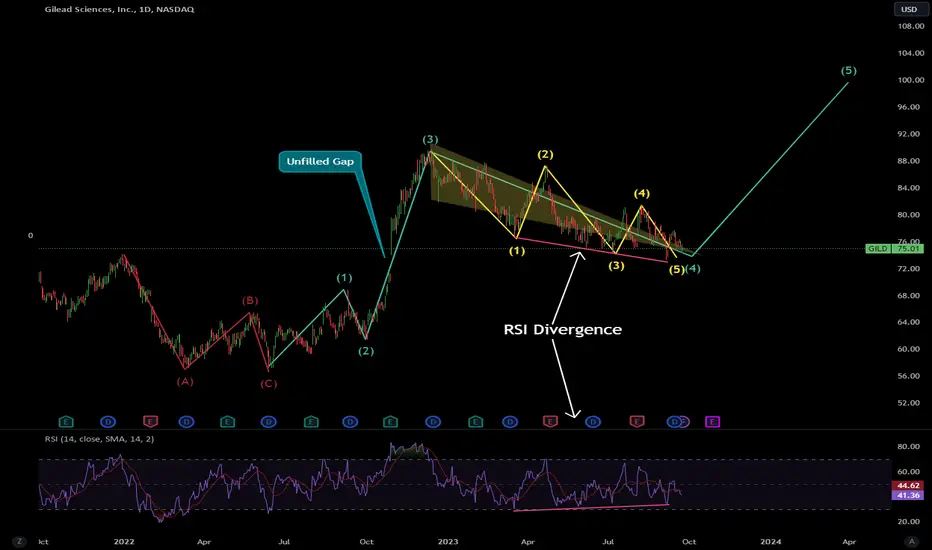
GILD on its March to 100After an A-B-C Corrective Wave (red coloured wave), GILD is forming a 1-2-3-4-5 Motive Wave (green coloured wave). Presently, 4th corrective wave (yellow coloured wave) of this Motive Wave is under progress.
4th wave can be a triangle (3-3-3-3-3) as is the case here. Within this triangle, each of the five waves has a three wave pattern.
There is a gap below the 4th wave, which has remained unfilled. With every move down, the 4th wave has unsuccessfully tried to fill this gap, which shows that GILD still has bullish momentum and gaining strength to go into the final 5th impulse wave.
5th wave is usually inverse 161.8% of 4th wave. This is 100 in case of Gild. Soon, we should see volume picking up, which will mean that the 5th wave has begun.
Finally, we have RSI Divergence in the 4th wave.
GILD - Bullish Breakout PossibleGILD has formed a bullish flag and price is above 20/50/100/200 EMAs. If resistance of 80 is broken, price will also go above upper trend line. First resistance likely at 84 after breakout and then at 91.

GILD long trap can happen here.. 🐻this stock has a history of breaking multiple SMA resistance which is usually bullish, but it always climbs back below and heads lower after that breakout.
I think longs should be very cautious, short term pump to 83 is possible, we dump after in my opinion though. boost and follow for more! 💛

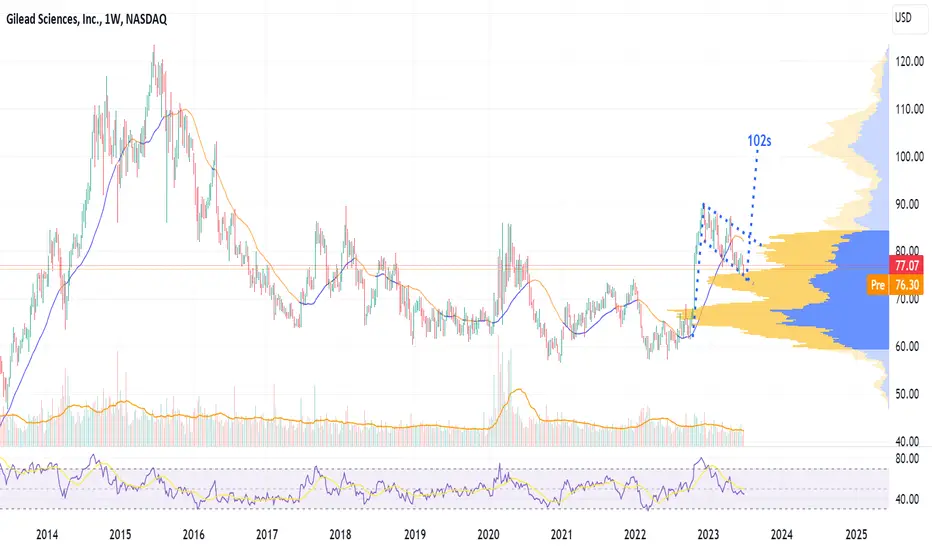
Dreaming for a bull flag in $GILDA bullish flag seems to be in development in the NASDAQ:GILD chart. It's not still clear but it could see $102s as final target. Invalidation below $73.
Bullish Alert : GILDThe previous 2 alerts didn't cofirm the combo.
This last alert already created a new crossover and positive price action.
Let's see if it will work out as always.

$GILD with a bearish outlook following its earnings #StocksThe PEAD projected a bearish outlook for NASDAQ:GILD after a negative under reaction following its earnings release placing the stock in drift D with an expected accuracy of 72.73%.

Let's short Gilead! GILDXABCD, ABC patterns at play. Confirmation via eMA, candlestick pattern. Here we go.
We are not in the business of getting every prediction right, no one ever does and that is not the aim of the game. The Fibonacci targets are highlighted in purple with invalidation in red. Confirmation level, where relevant, is a pink dotted, finite line. Fibonacci goals, it is prudent to suggest, are nothing more than mere fractally evident and therefore statistically likely levels that the market will go to. Having said that, the market will always do what it wants and always has a mind of its own. Therefore, none of this is financial advice, so do your own research and rely only on your own analysis. Trading is a true one man sport. Good luck out there and stay safe.

GILEAD Stock Chart Fibonacci Analysis 030423 1) Find a FIBO Slingshot
2) Check FIBO 61.80% level
3) Entry Point > 81/61.80%

[GILD] - Short / Downside drawLong-term weekly high - Liquidity PURGED.
We've seen a short-term low broken with bearish displacement candle; leaving a FVG (SIBI) in its wake.
We've seen price break down and trade back into the bottom of the bearish breaker twice, which is being highly respected with candle wicks and bodies.
Each touch we see price react and move away from the area dynamically, as it acts as resistance.
Targets and draws on liquidity is the sell stops liquidity resting below the relatively equal lows (RELs). RELs are too clean; make jagged.
Lower targets would be the liquidity VOID and the FVG (BISI). Also the small volume imbalance.

$GILD with a Bullish outlook following its earnings #Stocks The PEAD projected a Bullish outlook for $GILD after a Positive over reaction following its earnings release placing the stock in drift B with an expected accuracy of 50%.

$GILD: Nice setup for a month...Gilead offers a very nice setup here, upside as per the chart. You can expect it to do well during January if it holds over $85.43 for the most part, might consolidate again after February the 1st.
Best of luck if taking this one.
Cheers,
Ivan Labrie.

GILD SELL+++++ GILD has been stubborn AF on correcting, it will eventually and likely after my puts expire Jan 20 lol.
🟩 $GILD - taking a pilot here- Stock is getting in an early stage 2
- Buying off a low cheat
- Gross Margins increase
- Industry group is strong

GILD triple top failedGILD has been on a monster run, up one day, up the next and failed to pierce through the triple top. Bio pharma stocks are always difficult both short and long, every time I trade one it's always the last time. LOL $71 gap to fill
