4Hr Cup & Handle, Inverse Head & ShouldersLooking at the 4Hr GME chart, we can see the GME has broken out of the wedge and has formed a Cup & Handle as well and an Inverse Head & Shoulders. Also, the 15 min is showing a Bull Flag breakout. Bulls are out in full force. Quad witching is in 3 weeks also...
GS2C trade ideas

$GME - That time of the year againIt's a bit early to celebrate, but i see decent signs of another GME run happening soon, at least within February. I i said, it's a bit early and the data needs several more days of prints to verify, if that's the case, i'd be setting this post to "Trade Cancelled" and i'd make a new one in it's place when its time.
Now that warnings have been given, it looks like we might be having a strange and weirdly early run on GME, possibly covering before earnings, repositioning and dumping it on earnings.
If the above is true, Vix may be on its way to 19 by next week, SPY may be wanting to dump.
The data
imgur.com
There is a spike in progress. If it doesnt fizzle out, we're going to see some price action soon. The timeframe is still unclear. Initially i think we could see something next week but i need more data to verify. It is possible that this may be a buildup for a post-opex run, but it's still too early to say.
This run doesn't quite fill all my criteria for a run, but i'm posting it just in case. I also have secondary data indicating that this is already a dud/no run, but here we are anyway.
So we may see something:
-Next Week
-Around the 22'nd
-Or not at all
Updates daily. If i think nothing's happening i'll be setting the post to "Trade Cancelled". I wont be reading or replying to comments.

$GME : Price TargetsHi everyone,
Looks like leenixus wrote yet another hype post. These are 3 targets and the third being the top max. Earnings will be a different story, but until then GME will likely bounce between 13-16.
Good luck everyone.

Is The Game Stopping for GME?Despite its pending return to the $50-$75 range, Gamestop likely has a timultuous road ahead as it tries to sustain relevancy in a time where games can be purchased and downloaded without ever leaving the comfort of one's home.
There is also an increase of demand for crypto related gaming, where real world value is given to in game characters, and items. This is unlike the gaming world that's been dominated by Gamestop for so long, where consumers generally only have an output of value (cash).
I won't try to speculate on matters outside of the chart any more than I already have, but speaking on the chart's structure itself, it remains to be seen if Gamestop will withstand the long term descent which will likely put each stock below $0.25.
If so, there will be a lot of business restructuring that has to take place.
In Elliott Wave terms, it seems like a bullish extended flat correction has concluded. Basically, what generally follows is a new low; a new all-time low in this case.

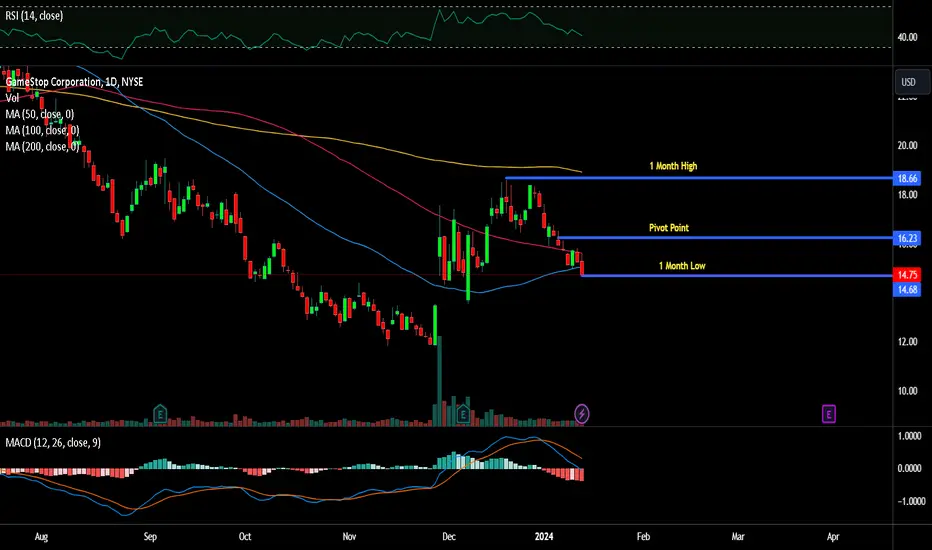
Retest of 18s?The daily rsi bounced off rsi ma and also the weekly rsi ma. As long as rsi stays above ma on weekly we are headed back to 18 imo. Price needs to get above the blue ma of bollinger band. But it also looks like a bear flag forming on the 4hr. Right now I'm long looking for $18.

Another likely outcome for GME.If the previous chart that I posted regarding GME doesn't play out as I hypothesized, this is another likely outcome. Prize rises slightly out of the wedge pattern, which will trigger many buy orders as many trader's would see that as a bullish sign, then sharply reversing, and dropping down below the wedge to the bottom (dashed) support line, leaving many bulls holding the bag at higher prices.

GME Will fly in the next days to the top of the channel!we can see bullish signal around this trendline, I will long here(13.9$), with target on the top of the channel(18$)

GME looks to be getting ready for a sling-shot bull-trap!With the recent bankruptcy of Evergrande, forcing the liquidation of its many short positions, rumored to include equities like GME, AMC, etc., many traders are expecting another brief 'short squeeze' as a result.
The charts seem to indicate that GME could make a nice move from current levels ($14.75), possibly even dropping to the bottom of the wedge to the $13.90ish level before bouncing to the upper trend line (white dashed line) to approximately the $18.42 level in the next 15 to 20 days (mid-February), followed by what I believe will be a sharp reversal from that level to a downward move over the 2 to 3 weeks following, back down to the $11.83 level.
If GME falls below the $11.83 level (lower white dashed line) on the charts, we could easily see the price drop below the $10 level.
If you study the chart, GME is pretty consistent about making a move, falling back, then retesting at or near the top of the previous high before pulling back, which in some cases gives you a chance to break even on a bad trade or even double-tap a successful trade.
Either way, GME can blow the doors off any size account if not traded with due diligence. No potential gain is worth blowing out your account. Great traders trade with discipline, and disciplined traders stand the test of time because they never put their ability to trade at risk. I personally never put more than 25% of my account at risk on a single trade.
Don't take these charts as gospel, but don't ignore them either! There are two types of traders in my books: followers/copy-traders and leaders/trail-blazers. Which one are you?
Good luck, and always use a stop or a buy-limit hedge!

GmeCould be finally bottoming might have a solid chance and decent risk to reward to load the boat here 14.22ish area with a target of 26$
This could take until end of April mid May to play out completely but could be worth the 1$ per share risk. I’d stoploss it close to 13.20/13.40 area.

GME Getting interestingThe grandpa of stonks is getting interesting here.
It's broken above the trendline, and it has retested it once.
I am going to pull the trigger on averaging down my "underwater" position when we test the trendline again and stay above it for more than 2 days .

GME TRENDS AND PRICE TARGETS, WE LOVE MEMESIf you've been following GME with me, you bought at 12.5 and below last month.
Sell target 1 was 16.9, we came close but lost a tiny bit on the first topside pump.
We bought the dip around 14.02 and below, and we were looking for 18, 21, and 25 with small retracements in between.
I'm not sure, but per indicators, it seems we might see the higher targets of 21 and 25 before we see the retracement targets of 10 and 8.
Faster and steeper we go up, the faster and steeper we drop, so remember, the time to be flinging money in without much worry was under 12.5. Now, you'll want to be trimming profits and compounding. How much should you sell and when? Only you can make that decision. However, feel free to use some my price targets if you're struggling to set your own.
If you're new to trading or my charts. We usually buy and sell on the major trends, and use the breakouts as a chance to compound profits, or simply wait for the right trade to present itself, whether bull or bear. Just because we are selling at these levels in a longer term trade doesn't mean there aren't chances to jump into shorter term trades. However, USE caution at these levels.
If you're bearish on this stock, you want to see it wedge down, and if bullish you want the breakout to the topside.
I tried to make this chart as simple as possible.
Squeeze targets included, but be REAL, it's unlikely, and it will be fast up and fast down should it occur. However, bears need to be real as well and realize that some of those topside numbers are very possible.
Options get a little wild around the 26 and 32 dollar marks I believe. You only wanna play with weekly options if you know how they move in relation to the price or you'll get killed from theta.
Good luck!

GameStop's Crypto Rollercoaster: The Rise and Fall
GameStop ( NYSE:GME ), the once-famed video game retailer that captured the financial world's attention during the WallStreet Bets saga, has decided to shut down its NFT marketplace. After a year and a half of foraying into the crypto space, GameStop ( NYSE:GME ) cites persistent regulatory uncertainties as the primary reason for discontinuing its NFT platform effective February 2, 2024.
The Rise to Crypto Prominence:
GameStop ( NYSE:GME ) first hinted at its venture into the NFT space in 2021, a strategic move that raised eyebrows in the gaming and financial communities alike. By January 2022, the company had assembled a dedicated team of 20 individuals to manage its gaming NFT marketplace and disclosed a partnership with Immutable, signaling its intention to utilize Immutable X's blockchain.
A $100 million fund, denominated in Immutable's IMX token, further solidified GameStop's commitment to the crypto realm. However, the excitement was short-lived, as the retailer promptly liquidated a significant portion of the acquired IMX tokens, offloading $47 million onto the market. This move raised questions about GameStop's long-term strategy in the volatile crypto landscape.
Challenges and Layoffs:
By July 2022, GameStop faced internal challenges, leading to undisclosed employee layoffs. Despite these setbacks, the company went ahead with the public launch of its NFT marketplace. However, the inclusion of Immutable X gaming NFTs didn't materialize until several months later, coinciding with the ousting of GameStop's CEO, who had overseen the company's initial foray into the crypto space.
The Unraveling of Crypto Ambitions:
Fast forward to the present, GameStop ( NYSE:GME ) has decided to bid farewell to its NFT platform, leaving traders and enthusiasts with questions about the company's abrupt exit from the crypto space. Notably, the discontinuation of its NFT wallet was declared approximately four months ago, raising eyebrows about the company's decision to stagger its departure rather than shutting down both products simultaneously.
Regulatory Scrutiny and Uncertainties:
GameStop ( NYSE:GME ) points to ongoing regulatory uncertainties in the crypto space as the primary driver behind its decision to cease NFT marketplace operations. The move comes amid a broader global conversation about the regulatory framework surrounding cryptocurrencies and NFTs. The absence of clear guidelines has left companies like GameStop grappling with the risks and challenges associated with navigating this rapidly evolving landscape.
Conclusion:
GameStop's rollercoaster journey into the crypto space, marked by ambitious plans, strategic partnerships, and subsequent exits, reflects the broader challenges faced by traditional companies venturing into the volatile world of digital assets.
TSLA and GME showing a very strong correlationI was just looking at both TSLA and GME on the hourly and low and behold, these charts are almost identical. Both inside falling wedges, and both with double bottoms. I'm unsure of the exact fundamentals on this one, but the charts do show that they are moving in unison. Keeping close eye on this.

Hourly Falling wedge on GMELooking at a small breakout of a pretty large falling wedge on GMEs hourly chart. If it can break these two supply zones at $16 and $17, It may re-test those $18.50 levels again. I would keep an eye on this one. Also if you zoom out a bit more you will notice a massive double bottom... On the flipside, we are also still inside the weekly wedge with a bit more space to play. GLTYA, and Happy Anniversary!

GME positive accumulation by institutionsMy Force Accumulation indicator is showing that institutions began massive shares-accumulation since the pop-off from $12 to $17s. Have a short-term target price of low $20s. However, based on the amount of accumulation, it's possible that institutions on the long side of the trade are prepping for an actual squeeze (possibly a gamma squeeze?) and we blow past resistance on the way up.
Short interest also seems to be increasing to make it look like GME falls when the SPY falls. In my opinion, they are trying to hide GME's launch within the general market's volatility. GME made a +50% this month, and media didn't bat an eye. One more +50% takeoff and we could be reaching close to the $30s.
Strap in boys!!

GME 50 EMA DefenseGME came alive in December and is currently retracing back to the 50 EMA. Things to consider, volume has been drying up since the initial move in late November, $15.41 is a strong level of support, but below that there's the gap all the way down to $13.55. January is usually a great month for this stock, but I'd love to see it defend the 50 EMA and the $15.41 level before going long. A bounce off support and a reclaim of the 50 EMA would be very bullish in my opinion

Possible trading opportunity A lot of bullish order flow coming in. Entering long on market open on Tuesday.
Please trade at your own risk. This is MY personal trade. I am posting this for educational purposes only.

$GME - Finally, but...I have 7 variations of these showing the same spike for GME and many other names in the market whilst only 1 other chart (the one i typically use to detect runs) shows that this is going back to 11-12.
imgur.com
Based on the above screenshot being so nicely parabolic looking, i think we're looking at a price in the early or mid $20's for now. Will keep you updated if it looks like it's going higher.
GME looks good to buy as there's likely even more of a pump after this not only for GME but for many other names showing similar and even larger spikes (e.g ABSI and many others imgur.com)
Looks like i was a week early on trying to catch the initial spike of the run. I had MIL:1K of calls expiring on the 24'th of Nov knowing that it could've easily skipped that week and gone for the next one as it has done many times before and ther we go... it did just that.
Anyway, GME's IV is extremely high ever since my last post, so i'm not touching it neither in terms of options nor in terms of shares. I've chosen to get burnt on SPY puts instead with a decent amount of theta this time.
I have positions in SPY, ABSI and a bunch of other stocks that i won't mention as ya'll will crowd up in them and kill em.
Decided i'll give you this one since i'm out of this one due to high IV, so i'm throwing this one to the dogs. RC gave a beautiful signal on his tweet signifying there would be a run so i guess the data is confirmation (Or the opposite)
Be careful of the upcoming COST earnings after SPY's dividends next week, if the retailer pumps, the sector stocks e.g GME and others will pump to and will vice versa. COST could be the reason we pump or we might pump before COST earnings and then dump on it's earnings.

GMENot financial advice. The essence of investing & trading is the intelligent and patient preying on the greed, fear, impatience, addiction and ignorance of the majority. It's definitionally Darwinian.

1HR Cup and Handle Tracking a beautiful Cup & Handle on the 1 hr. Keep an eye on this one, looks like we are about to form the handle before the breakout.


Waiting to see how this head and shoulder plays outShort Squeeze is unlikely to happen again
NYSE:GME
GameStop's Split Will Be a Stock Dividend
Dividend stock split isn't likely to affect short sellers. While shorts would be required to pay a cash dividend if GameStop issued one, a stock dividend works pretty much the same for all investors regardless of whether you're short or long. The effect is to increase the share count and lower the share price using the split ratio and there are no extra shares to pay back

GMEGameStop broke above major trendline. A retest would likely open the doors to $28. On a longer horizon it may complete the triangle at $120.
Well , anything can happen so near end target is something to reel in some fish
