GME Since 11/28GME ran up 11/28 and has formed a wedge(yellow trendlines) and possible triangle(purple line) within wedge. Possible triangle because the structure already broke and at the time of publish, the window of likely breakout(horizontal white lines) has passed.
Volume diminishing
Rejecting 13EMA and finding support on 48EMA at time of publish.
GS2C trade ideas

be careful with your gme contract dates, short update.I will be rolling my contracts on gme past january 2024, in an affect to catch the squeeze.

GME: $331 Triangle measured move on Log chartIt will take a long time but it is worth it. NYSE:GME rises because of excessively overweight short interest, nothing more. I don't know why GME has accrued such excessive short interest, but the TA on the chart says that move happens eventually, again, given that the short interest never got cleared out. The Monthly support level gives a good clear r/r trade.

gme to 840-880$ coming soonthe algorithm speaks.. listen carefully, you might miss it.. she blows for us every now and then! not financial advice!

gme to $60... then 4300?fractals and resistance can tell us quite the story.. lets see where she goes.. personally im in calls.. we have alot of things in our favor.. this is all hypothetical and not financial advice, goodluck


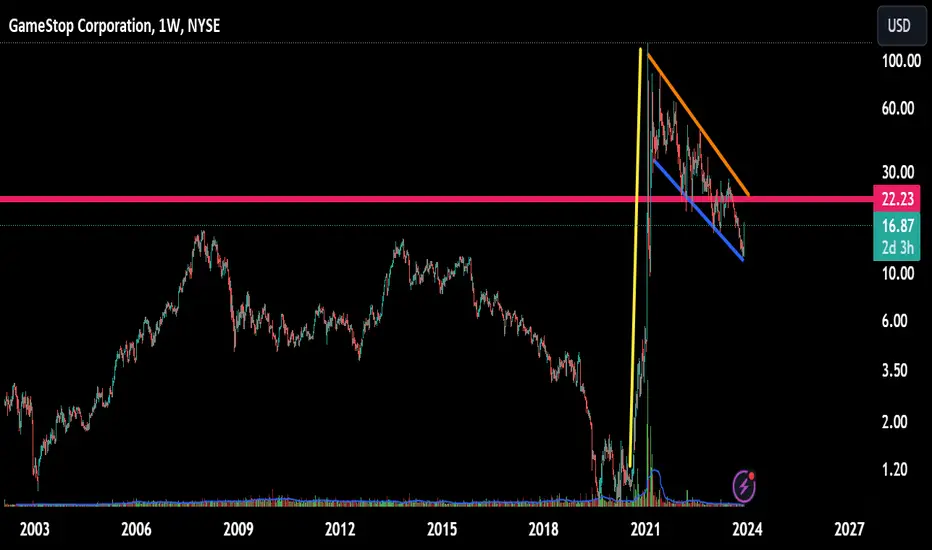
Short the 76 retracementGME made a parabolic rally. A first top at 76 and now has made a 76 retracement of that drop.
Might be the end of the bear market rally here.

GME back in actionI see GME as a great stock to swing trade and it has been trying to break the area it is currently on "where i have outlined with the blue box" for 4 days it may not seem as if its been in the same area that long because its a 15% range. which makes it great for day trading. If it closes above 16.80 I am targeting 19.50 if it comes back to 14.50 ni will then target 16.50 and hope for a break to 19

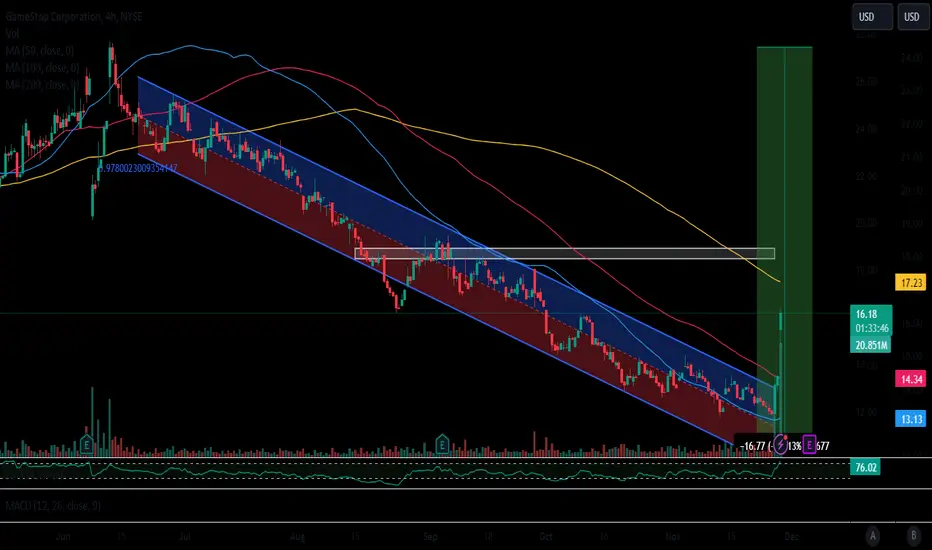
GME - Swing Long opportunityGME brokeout of the downward parallel channel on 28th Nov at 13.53.
After running high to 17.52 it has retraced and showing a bull flag on daily.
Closing the gap at 13.63 might launch the next bull run to 18.02 and then to 19.40 where it has major 200 DMA resistance.
Entry:13.63-13.89
Target: 18.02-19.40
Support: 12.61-11.88

GME GameStop Options Ahead of EarningsIf you haven`t sold GME before the previous earnings:
Then analyzing the options chain and the chart patterns of GME GameStop prior to the earnings report this week,
I would consider purchasing the 15usd strike price at the money Calls with
an expiration date of 2024-1-19,
for a premium of approximately $2.63.
If these options prove to be profitable prior to the earnings release, I would sell at least half of them.
Looking forward to read your opinion about it.

15 MIN showing a Bull flag, Cup & Handle, and an Inverse H & STracking 3 bullish trends on GME 15 MIN. a Bull Flag, Cup & Handle, and an Inverted Head and Shoulders. Lets see how this plays out. If we use the FIB EXT as a gauge we could see a bounce to 17.80 on the 15..

ENTERING A SHORT FOR $GMEThe stock is still a meme stock and retail investors don't have the money to keep the stock hyped.
when you look at options people who predicted the pump are out after making a killing on it.
you look at charts and you can agree that the stock is in a downtrend and it is now facing a trendline resistance.
No fundamental reason for the recent pump. NYSE:GME

YUUUUGE Bull Flag $GME!!!! NYSE:GME Whoa! Havent looked at this chart in a while. I just drew the downtrend support line and flag pole today. The downward resistance line has been there for months now without me changing or modifying. Seems to be now breaking out of that channel. My 1st target would be long 22.00Calls. Then after wait for confirmation or yolo target 27 OTM calls. Hit me up on snapchat DM for a free trade idea @Shonufftrades
GameStop's Stock Experienced a Sharp IncreaseKey Takeaway
1. Investors eagerly anticipate GameStop's Fiscal Q3 2024 earnings report scheduled for December 6th, following the recent stock movement.
2. Despite challenges, there's speculation that GameStop could report a profitable quarter, presenting a potential catalyst for its shares and contributing to a noteworthy turnaround.
The Reversal Is In
GameStop's (GME) - recent stock performance has shown signs of a turnaround. After a decline of more than 55% since its peak in mid-June, GameStop shares surged 13% in the trading session on November 28, with an additional 12% increase in after-hours trading.
While there isn't a specific catalyst related to business fundamentals for this short-term reversal, the most plausible reason is the stock's extended stay in oversold territory since September. The 14-day Money Flow Index (MFI) has been trading below 20 for the first time since July 2019, signaling an overselling condition. Additionally, the Relative Strength Index (RSI) has been hovering very close to oversold territory since mid-October.
GameStop's Earnings Just Around The Corner
The recent reversal in GameStop's stock occurred just ahead of the company's Fiscal Q3 2024 earnings report scheduled for December 6.
In the preceding three quarters, GameStop reported earnings per share (EPS) of 0.16 cents in January (primarily attributed to a robust holiday season), -0.17 cents in April, and -0.01 cents in July.
It's important to note that the October quarter, which precedes the holiday season, poses challenges for the video game retailer chain. The third quarter is commonly a seasonally slow period for retail companies, lacking significant holidays. Furthermore, the release of major gaming consoles and blockbuster video game titles typically occurs in Q4. Consequently, consumer spending patterns may decline compared to other quarters, especially on non-essential items like gaming products.
Price Momentum
GME is trading near the bottom of its 52-week range and below its 200-day simple moving average.
What does this mean?
Investors have been pushing the share price lower, and the stock still appears to have downward momentum. This is a neutral sign for the stock's future value.
A Price, A Retard, And An Impossible Number: The Ballad Of $1700Okay.. We all know who/what I am here, and if you don’t then you’re new and I welcome you.
Let's imagine we're a financial entity, with:
market making privileges in equity, and a large market share of order processing, meaning we could, potentially, internalize demand as liabilities (IOUs/FTDs) or let them pass through to the market.
with access to all standard products, meaning we're only limited by having to find a counterpart to any financial instrument we might want to use - even bespoke instruments.
a big balance sheet.
a large contact network, including political, enforcement and media.
a widespread reputation of "knowing what we're doing" in a field in which very few people know what they're doing.
For some reason or another, we decide to short a stock - we're fairly confident that it'll go bankrupt. Why we are so confident is irrelevant - we just are. However, we're not really allowed - or it's suspicious, or just want to avoid the connection - to have a position in the securities we market-make, therefore we use our network of institutions to have a series of hedge funds - not us, but bound to us through shared ownership or debt or aligned incentives or whatever - hold the short positions for us. It's also possible that these hedge funds are taking this short position of their own volition, and we have nothing to do with it yet.
The point is, this specific stock has a growing short interest. It's easy to find the shares to borrow. All broker-held shares are kept within the DTCC books, that means they're all kept in a neat pile. We can borrow from the pile/warehouse and throw a few pennies back as fees. We then sell these stocks to retail, so the stocks end up right back on the borrowable pile - they never "leave" the brokerage, and the brokerage stores them in the same pile. We're adding a liability (the short stock) and an asset (the cash) on our sheet. They're fungible, and it's all happening in aggregate and behind closed doors, so nobody has actual proof - hell, nobody has reason to suspect in the first place, since the stock in question is a "bad stock," according to the news, and so the collective meme says it should go down. Since each sold stock goes back to the pile, there's no shortage to the borrowable supply, and therefore no reason for the interest fee to go up. We can keep pointing at a share, using that share to create a liability, receive cash, and then point at the same share again. Also, if we occasionally/often fail to deliver/borrow, who's gonna notice, let alone stop us, right?
In essence:
Customer bids/demands a share.
The bid is routed to us by the broker.
We grab a share from the borrowable pile - add this to liabilities. We add this same share to the customer's assets. We also take the customer's cash from their assets, and drop it in our assets.
The customer's share is stored in the borrowable pile, thanks to the broker, so the pile's size hasn't changed.
Result: Demand is satisfied. The borrow pile is unchanged. Our liabilities grow. Supply is not reduced. We took the customer's cash.
We just need to be careful about the reporting methodology - make sure everything's tidy when the picture's taken, and as long as the pile is large enough relative to the daily volume, it's foolproof.
Alright fantastic, each sale is free money, and the sold stock goes right back for-sale. Unnoticed, we're actually recycling the supply. The demand, on the other side, isn't - buyers need actual cash to buy, and that shit runs out. With endless supply and limited demand, the price goes down. Price going down should increase demand, but as long as the price is expected to continue going down, then that's neutered - people don't buy because the price is low, but because they expect it to rise. Besides, more demand means more sales, and more profit, yes? Eventually, we're confident the company will go bankrupt, and then we'll just be left with two piles: one of cash, and one of worthless liabilities, valued at 0. Pure profit, no need to even pay taxes, since we didn't really close our positions.
Then, two things happen. First, some schmuck begins actually looking at the numbers - "bad stock" meme isn't enough for him, and he realizes that the stock is too cheap, related to the fundamentals. He begins buying and spreading the word, which challenges our preferred meme. Suddenly, there's a narrative of counter-culture/resistance around buying the stock, it's seen as giving us the middle finger, and the kids think that's cool. Whatever, let's underestimate them. The second thing to happen, is that another guy - this one actually has three commas, so he's a bit more difficult to deal with - buys a bunch of the stock, and declares his intent to become an activist investor. He maneuvers intelligently, and before long, he's chairman of the board. While we're good at making memes for boomers, this dude is good at making internet-native memes, and he, without ever actually interacting directly with the community, manages to cement himself as a trustworthy, competent figure, opposed to wall street and internet savvy. He outlines a turnaround plan which actually - independently of everything else - makes sense, and he brings the drive and level of compromise a founder figure can provide, as opposed to distant institutional owners.
Now, a short position is a leveraged position, meaning we can be margin called if our unrealized losses exceed our collateral. Therefore, as the stock price stops going down, and begins going up, we have to begin to actually monitor the stock price and the short position size, versus the rest of our assets - and not all assets, but those considered high quality liquid assets, and therefore valid collateral. The way this works is, different asset types get assigned different weightings: the more liquid and risk-free the asset, the higher it counts. Cash is completely accounted, at 100%, but a risky bond might be counted at 10% only. Some assets might not count at all. The difference between the average short-sale price, and the current market price, multiplied by the short position size, can't exceed our high quality liquid assets, or we get a margin call.
Liability: Current Market Price * Position Size, the value of the equities owed
Assets: Average Sold Price * Position Size, the cash we got for the sales
Our collateral must be greater than the difference between these.
`(Average Sold Price - Current Market Price) * (Position Size) < = Value of HQLA
Suddenly, demand - which has been growing steadily thus far - spikes. This has gone viral, and the transacted volume goes insane - way beyond what we can handle. The daily demand is bigger than the pile, so we're forced to let some of it through. Our methods had not been stress tested before, and thus we slipped. This means the price starts increasing, which fuels both more demand - from FOMO - and more supply - from people who consider the stock overvalued, and an easy short. The internal supply chains break, suddenly everyone's getting margin requirement notifications. The brokers don't necessarily know what's happening, all they know is that they sold a lot of the stock, and before they can turn around and buy it from us, the price has doubled - margin requirements go up! So, seeing this, trading is stopped at the broker level - they literally can't afford to owe any more shares. The apple store is out of apples. Close only. We, however, can keep selling, and we do. No new long positions, only new short positions - perfect, the price has to go down, regardless of the demand! The price falls down, the news spin this as a squeeze that's now over.
The price falls all the way down to 40$, and then something breaks. Someone gets a margin requirement they can't meet, or someone places a buy order that's large enough, or something else happens, and forced buying begins, which again spikes the price. Liquidations are carried out, and at some point, these short positions end up in the market maker's books. While a hedge fund can get killed from such a spike, not us. We're a massive player, and we can sustain a lot more. We consolidate most of the short positions, to avoid any further melt-ups, and formulate an actual long-term strategy to get out of this mess. Melvin, Archegos, and others, are now dead, and we hold their books within ours.
Up to now, we've had to survive by using collateral against the short positions, which means that, at a certain point, we need to liquidate non-qualifying assets, and turn them into cash (or some other acceptable form of collateral.) Therefore, when the stock price rises, we need to sell our other positions, and turn them into cash. This explains the stock's negative beta: when its price rises, we sell other stocks to raise cash, which lowers their prices. When crypto is no longer acceptable collateral, we sell it for cash, and the price dumps around June. So, in essence, the stock price has an inverse correlation to the price of anything else in our books that's not collateral.
However, this isn't the best way to handle this - this is affecting the rest of our business, and won't work in a longer timeframe. Since we're a market maker, we don't really need to do the whole song and dance around borrowing shares, and holding collateral we can just directly create them as liabilities. This is the famous Fail to Deliver - they marked your assets and their liabilities, but that's it. Also, instead of being worried about collateral we're now worried about solvency.
Okay so we turn around to security based swaps/total return swaps. What are these? They're a piece of paper that's worth the difference between the values/returns of two securities. I can then replace the shorts vs. collateral method with swaps. No need to bother so much with high quality collateral, since whatever's on the other side of the swap essentially functions as collateral - I only need collateral for the difference. I can get a negative exposure on the stock price, against a positive exposure on the overall market. This way, if both go up together, then it makes no difference to me. Likewise if they both go down together. Any decrease in value from the movement of one is offset by the movement in the other. Let's assume our swap is done against a broad market basket and call it the counterweight (CW.) Now, instead of the stock and the market having an inverse correlation, they have a positive one. If the stock goes up 10%, then as long as the CW also goes up 10%, then the value of the swap hasn't changed. I don't have to massively sell anything, it's less suspicious, reporting rules are way more relaxed, the enforcement agency is much more, uh, amenable to my proposals. This works both for being long stock vs short market, or long market vs short stock - I can finetune my exposure both ways.
Importantly, what before were these counter-cyclical spikes, are now pro-cyclical. Has the stock gone up? Nah, it's the whole market, nothing suspicious! While before we counteracted the demand with short-selling, now we just fail to deliver - essentially neutralizing demand. Sure, that's even more troublesome, but nobody's ever paid any mind to Dr. Trimbath before, why would they start now? So if anyone buys the stock, we just add that to our liabilities, without it impacting actual market supply/demand. We can selectively decide to let some demand pass, in case we need to raise the price.
What this brings about, then, is a delicate balance:
we can let demand for the stock reach the market, in which case the price increases.
we can let demand for the stock go to our liabilities directly, in which case the price decreases.
Then, we can observe demand/supply, and have an algorithm decide which % of purchases to deliver. Monitor social media. Bullish sentiment? Sell them calls, and reduce the delivery % (let the spot purchases go directly to the balance sheet) - price doesn't rise. Bearish sentiment? Do the opposite.
So now If the stock's demand goes up, we can decide whether to lower the delivery %, through which we avoid a price increase, but in exchange become more levered. We want the price to be as high as possible, up to the point in which we get margin called - the ceiling. Therefore, we'll deliver as much as we can, and start FTDing when the price gets too high.
If the stock's demand goes down, we can decide to increase the delivery %, through which we lower our leverage, but in exchange the price doesn't go down. We don't want low prices: more people will buy, and we'll lower our average entry price. Therefore, we'll reduce leverage as much as we can. We might prefer to lower the price, but that'd depend on more meme-manipulative strategies, and not market-based ones.
Therefore, we observe demand + supply, and decide what % to internalize, and what % to externalize, thereby controlling the price. Depending on how big of an institution we are, we might be able to do the same, to a lesser extent, to the CW itself. Say, if we processed 70% of all orders, who's to say we can't nudge the S&P a bit, eh? Even if we can't, though, that's unimportant.
If the CW's price goes up, that gives us more breathing range. We can tolerate a higher ceiling stock price without danger, so we'll internalize less, reducing leverage, and increasing the price, until we reach the new, heightened ceiling.
If the CW's price goes down, that gives us less range. We can tolerate a lower ceiling high stock price or risk a margin call, so we'll have to internalize more, and become more levered, but lowering the stock price. Alternatively, we may choose to pump the CW - a couple million hitting the ask at the right moment should be enough.
We have, then, two variables of import:
the CW's price, over which we may or may not have a degree of influence.
the stock price, which results from demand, which we observe, and % of FTDs, which we control.
In this way, short selling is something we long stopped doing. Did the shorts close? Not really, but who cares. The question is whether we still have an exposure to the stock price, regardless of the mechanism.
Up to now we have a nice little model. It's not infallible: our control over the variables might not be perfect, and if demand doesn't stop we'll eventually be in trouble, but these dudes need to eat - wait long enough, and they'll get discouraged. A split, you say? The size of my liabilities hasn't changed. Yeah, they're 4 times as many stocks, but IDGAF about stock number - I care about the notional size of the position. "In the shape of a stock dividend"? Yeah, nope. Spread some confusion about it. What can they do? Yeah, they'll seethe, but they've already been seething all along. If someone in an actual position of power comes around, we'll send some guys in suits to dazzle them with words. Who will they believe, the suits, or cherrypicked examples of particularly stupid apes? We like the chaos. The more chaos, the more tiring it is to find the truth, and the longer we can get away with shit. Unless the company withdraws from our system. In which case, I have no idea, because the debate shifts over to the legal battleground instead.
What else could threaten us? Well. You know what. DRS. (Direct Registration of shares) Moving these lendable shares out of brokers hands, and off of the DTCC.
On one hand, if 100% of the shares are accounted for outside our system, then we're suddenly on the defensive. Now they don't really have to care about what we say the price is, do they? They could separate completely, accounting for all the shares, and trade within a separate system. What would we do with the deluge of DRS that'll hit? I have no idea, but it seems like the supply/demand equivalent of dividing by zero.
On the other hand, every share removed is, essentially, forcefully accounted demand. Say, you buy a share, I drop it on liabilities and FTD, and then you DRS it, then you're indirectly increasing leverage, since (total shares in books/actual shares in my vault, "the ratio") just got reduced by one on both the numerator and denominator. Do that enough times, and since the numerator is higher than the denominator, we're gradually increasing the ratio, which makes the effect of demand on price have a larger magnitude. How? Because the ratio is also the ratio in which I transform demand into either a price increase or leverage. When we turn demand into price increase or leverage, the rate at which that happens is that ratio - the more we DRS, the higher the "cost" of turning demand into price or leverage. Meaning, the more we DRS, the more violent price changes will be, and the more magnified the leverage assumed will be. DRS 100%, and that rate becomes
Therefore, a separate market observer might want to consider two indicators as endgame conditions:
the DRS percentage + its rate of change, which can be proxied by the price of the stock, against some measure of how much free cash retail has, because this determines the speed of DRS. The lower the price, and the more available cash, the faster DRS will increase.
the price of the stock, against the CW (let's assume a broad market index of multiple asset classes.) If the stock outpaces the market, then we know the swaps are closer to breaking - this will have two possible effects:
every time except the last, it will cause the stock price to go down, or the market prices to go up, to keep the swaps alive.
eventually, the swaps will die, and then the stock will go up, and the CW go down, in a self-reinforcing de-leveraging.
So now what the hell happens? I have no clue. I wouldn't want to find out, either. I'd take more and more risky moves. If at one point I'd have been careful about the legality of my moves, then by the end that wouldn't really matter much. Might even want to try to get political power to leverage that. After a certain point, the capital market problem spills over into the legal, social, memetic, political. Whoever's managing this shitshow hasn't slept well in a while, I can guarantee that.
Let’s see how this Ballad continues/pans out, If you made it down here I commend you for at least taking the time in reading this.To all of my Retards, I will see you on Banana Planet.

The Rise of GameStop Memes: A Revolutionary Approach to CryptoThe world of cryptocurrency is witnessing an intense battle for a 100x return on investment, with Meme Coins leading the charge. While coins like Avalanche (AVAX) and Shiba Inu (SHIB) have been in the spotlight, there is a new contender that is turning heads and intriguing investors with its unique approach – GameStop Memes (GSM).
Avalanche has experienced a remarkable surge, with its prices skyrocketingan astonishing 200% between October and November. This upward trend can be attributed to strategic announcements and partnerships that have ignited bullish momentum. The recent introduction of Avalanche 2.0, aimed at enhancing speed, integration, and interoperability, positions the network to become a robust foundation for the trillion-dollar crypto industry. Partnering with industry giants like JPM, Citi, Wisdom Tree, T.Rowe Price, and KKR has further opened doors for broader adoption and institutional exposure.
On the other hand, GameStop Memes takes a different path. Instead of relying on partnerships and technological advancements, GSM leverages the power of community-driven dynamics and meme culture to create a distinctive appeal that goes beyond the traditional crypto narrative. By doing so, GSM positions itself as an accessible and engaging option for a diverse range of investors.
Shiba Inu, however, has taken a different approach to increase its token’s value. The strategy of burning tokens aims to lower the quantity in circulation, but its effectiveness remains a subject of debate within the crypto community. With a large circulating supply in the trillions, significant token destruction is necessary to have a substantial impact on SHIB’s price. While recent increases in SHIB burn rates are noteworthy, they have only affected a negligible portion of the total supply.
In contrast, GameStop Memes has found success through its unique blend of humour-driven community engagement and solid tokenomics. The project’s focus on meme culture and its incorporation into everyday life resonates with investors looking for transparency and practical investment options.
As GameStop Memes continues to make waves in the crypto space, it has raised $2 million in just 24 hours during its presale phase, showcasing its potential. With its innovative and community-driven approach, GSM stands as a revolutionary player in the crowded crypto landscape. Beyond the allure of rapid gains, the project integrates practical utility, making it a dark horse that could disrupt the market with its rebellious nature and potential for 100x returns.

Massive Falling wedge on GME weekly!!!!!!!!!!!!!Just wanted to point out that GME has now reached the end of this massive falling wedge on the WEEKLY. A breakout of this wedge could be absolutely massive to the upside.
Also, the last time the Ultimate RSI was this low, shortly after we seen a 155%, $19 to $50 spike in just 14 days.
With new legislation for reporting short positions and the pressure on the Hedgies to finally close out, this could be the move everyone has been anticipating. Not to mention the massive amount of DRS'd shares we have been seeing.
Grab your fav snack and bev because the extravaganza is about to begin. GLTYA, and happy trading ✌️

$GME - MehHad multiple false positives over the past several months that showed this stock might've done something. This includes the latest false positive showing something happening this week.
imgur.com
Although it appears to be strong, it's still very likely a false positive. I had some money on this but i've exited my calls and gone for puts instead as i see it possible that this thing goes to $10.30 in the next 12 weeks.
As i previously said, i won't be mentioning future GME runs. Only mentioning this one and the last few failed ones since they're done/failed. Too few people interested in this ticker, too many people holding stock and silently overtrading it for it to ever do anything significant at this point imo.

GME: Buy idea: Spring effectOn GME as you see on the chart we have a good spring effect on vwap indicator so it's mean that we will have a hight probability to have an uptrend.Thanks!

Potential Inverted Head & Shoulders - GMEHere I have GameStop stock on the 4Hr Chart exhibiting signs of a potential Head & Shoulders pattern! GME hit its 52-Week Low last Monday so I believe this could be a great area for a potential reversal in the Bullish direction!
www.tradingview.com
The Neckline @ 14.30 has been tested twice now, once after the creation of the "Left Shoulder" and again after the creation of the "Head".
Now what I expect for GME is for price to come down for the creation of the "Right Shoulder" with Pattern Invalidation at 12.90!
-Pattern Prediction-
*If price Breaks Down and Closes Below 12.90, pattern INVALIDATED!
*If price Breaks Up and Closes Above 14.30, price action initiates my Trade Action Plan!

Not a gme guy but maybe just maybe calls go brr next week??GME Seems to be trying its hardest break daily trend line and has already surpassed 9 ema (best ema, dont even try convincing me otherwise) if we get above 9 ma on weekly from some volume this week I think it will get violent not next week but the week after. Will be watching closely. Not financial advise, just my thoughts

GME: Buy ideaBuy idea on GME as you see on the chart because we have the breakout with force the vwap indicator and the resistance line by a big green candle follow by a large green volume.Thanks!

GME: Buy ideaBuy idea on GME as you see on the chart because we have the breakout with force the vwap indicator by a big green candle with a large green volume.Thanks!
