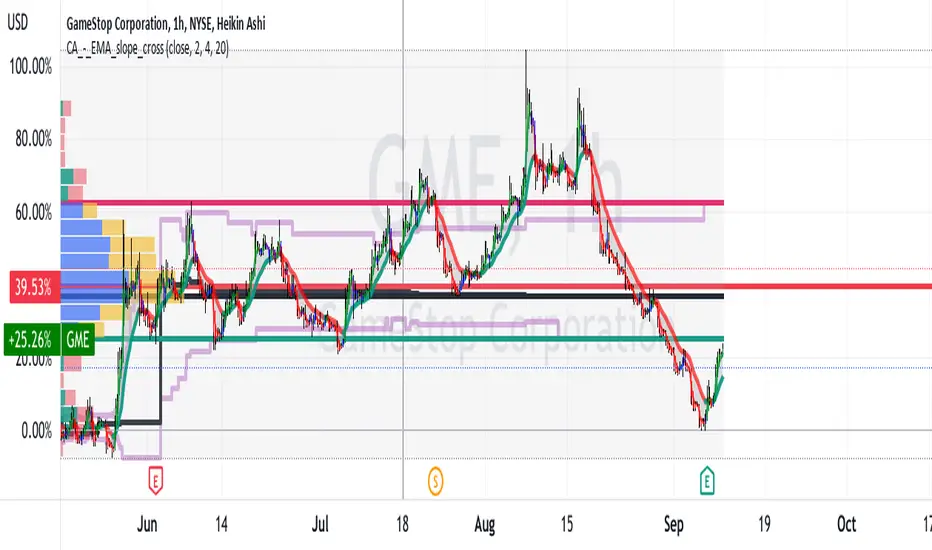
(UPDATED)Revisiting my prior theory on creation of FTDs thru TTTInstead of explaining why I believe GameStop still has immense value, I am just going to make an update to my previous 3 posts on creation of “Failure to Delivers” through SWAPs and the short ETF, “TTT.”
Please check out my other posts if this type of stuff interests you, it is brand new information that just hasn’t been picked up by anyone yet, the correlation between TTT & GME is blatantly painful to look at, considering the amount of people who ignore it.
I strongly believe TTT is being manipulated to then also manipulate GME..
We’ve watched GME follow closer to SPY on intraday trading than apple, Microsoft, or even amazon!! WHY?! Crime is the answer… algorithms.. liquidity grabs.. it’s all one big game in which we will end up victorious this time.
Now.. for the reason you are all here.. looking at the updated chart above, you can clearly see that TTT has been going straight parabolic ever since we’ve dipped from over the 40’s.. interesting right?? Around when Mayo Man moved over half a billion dollars for “strategic setups.”
BS… my real opinion is the price has been even faker than it has ever been since August 8th. I believe this could potentially be the end game short ladder attack..
Mark my words..
Educate yourselves with my ideas on all of my other posts.. it’s okay if you disagree.
DRS
TO THE FKN MOOOOOOOOOOOOON
NOT FINANCIAL ADVICE
IM NOT SELLING
GS2C trade ideas

CARL MTHAFKN ICAHNBig ups we go.
PT $100 by end of Jan
Not financial advice
Go follow my 10,000 other posts on GME to gain my perspective.. because it’s way too much to even summarize on here.
DRS

GMEBouncing off the long term support after OPEX, and breaking out upwards. With $XRT on RegSho and subject to forced settlement of Fails to deliver, I expect a nice jump in $GME's price

Basket AnalysisLooking to compare the YTD price change across a list of basket stocks that can be found here - www.tradingview.com

GME | SHORT | 50% DeclineNYSE:GME
Possible Scenario: SHORT
Evidence: Price Action, Recession
TP1: 15.5$
TP2: 12.5$
TP3: 5.5$

Gamestop: Bump and Run Reversal Top ProjectionI think GME is preparing to Square-Up the Range to return to a 78.6%-88.6% Retrace once it Breaks Down Below the Equidistant Channel of this Bump and Run Reversal Top.


Leave the Ponzi!Friendly reminder to sell before GME is crashing for real.
For the people that keep holding this, i hope you only invested what you can afford to loose.
Reasons for it to fail are in the linked Ideas.
It held up for a long time but i believe it is time for it to crash next month under the current FED policy.
GME is a Ponzi.
DYOR, this is no recommendation to short it either.

GME: T+69 is Back! Huge Upside! Hello everyone,
Welcome back to yet another technical analysis. T+69 has only failed once and that was Friday, Jan 7th, 2022 and all the other times it was successful. Although I considered it a failure, we still saw huge volatility that day with a high of $40.08 ($160.32 pre-split) and a low of $33.13 ($132.48 pre-split). This cycle, historically, has been the most accurate and it looks like we're heading into another 69 baby! Are we going to see similar events to Jan 7th or are we going to see a huge upside the week of Oct 10th - 14th?
Let's take a trip down memory lane and look at the last T+69s:
After the events that unfolded on June 8th, 2021,
Friday, Aug 19th-Aug 24th 2021: +50.55%
Friday, Oct 29th - Nov 3rd 2021: +43.65%
Friday, Jan 7th, 2022: (Depending on how you look at it) -17.35%
Thurs, Mar 17th, 2022: (The week of RC and friends buy-in) +157.04%
Weds, May 25th - May 26th, 2022: +71.23%
Tues, Aug 2nd - Aug 8th, 2022: +49.22%
Mon, Oct 10th - Oct 11th, 2022: ???
Analysis
On the daily, it looks like we're heading into a death cross. The question is will this be another successful one or are we going to test it? Tiny gap to fill at around $25.42 and if we happen to fall we should see us filling another gap at $22.44 (visible on the hourly) and another fall below results in us touching a potential double bottom at $19.50. If successful, should we break the above resistance, we should see filling the gap at $37.30 and $40.27 and the off chance finally closing the gap that was left at $73.
As always, not financial or sexual advice. I eat crayons for breakfast and can't read.

Gamestop to breakdown from a descending triangle.GameStop - Intraday - We look to Sell a break of 23.28 (stop at 24.72)
Daily signals are bearish.
Price continues to trade within the triangle formation.
The bias is to break to the downside.
Support is located at 19.50 and should stem dips to this area.
Our outlook is bearish.
Our profit targets will be 19.66 and 18.66
Resistance: 27.00 / 28.00 / 30.00
Support: 24.00 / 23.50 / 22.00
Disclaimer – Saxo Bank Group.
Please be reminded – you alone are responsible for your trading – both gains and losses. There is a very high degree of risk involved in trading. The technical analysis , like any and all indicators, strategies, columns, articles and other features accessible on/though this site (including those from Signal Centre) are for informational purposes only and should not be construed as investment advice by you. Such technical analysis are believed to be obtained from sources believed to be reliable, but not warrant their respective completeness or accuracy, or warrant any results from the use of the information. Your use of the technical analysis , as would also your use of any and all mentioned indicators, strategies, columns, articles and all other features, is entirely at your own risk and it is your sole responsibility to evaluate the accuracy, completeness and usefulness (including suitability) of the information. You should assess the risk of any trade with your financial adviser and make your own independent decision(s) regarding any tradable products which may be the subject matter of the technical analysis or any of the said indicators, strategies, columns, articles and all other features.
Please also be reminded that if despite the above, any of the said technical analysis (or any of the said indicators, strategies, columns, articles and other features accessible on/through this site) is found to be advisory or a recommendation; and not merely informational in nature, the same is in any event provided with the intention of being for general circulation and availability only. As such it is not intended to and does not form part of any offer or recommendation directed at you specifically, or have any regard to the investment objectives, financial situation or needs of yourself or any other specific person. Before committing to a trade or investment therefore, please seek advice from a financial or other professional adviser regarding the suitability of the product for you and (where available) read the relevant product offer/description documents, including the risk disclosures. If you do not wish to seek such financial advice, please still exercise your mind and consider carefully whether the product is suitable for you because you alone remain responsible for your trading – both gains and losses.

Analysis-Big probability of a downtrendHello!! As you see on the chart we will have a big probability of a downtrend after the breakout with force the support line and the vwap by a big red candle with a large volume. In other hand we will have a continuity of an uptrend after the breakout with force the resistance line by a big green candle with a large volume.Thanks.

AnalysisAs you see on the chart we will have a continuity of an uptrend after the breakout with force the resistance line by a big green candle with a large volume. In other hand, we will have a downtrend after the breakout with force the vwap indicator and the support line by a big red candle with a large volume.Thanks.

GME stock, Oct 13 J. Powell speechbecause Jerome Powell will speech Oct 13, 2022. if he said so so we can prepare which call or put. good luck!

GME TRADE SETUP - POSSIBLE 24% GAINI'm seeing potential for another GME 24% run in the near future.
The trade is going to be an entry sometime in the next few days @ or under 25.71
The sell price we are looking for is around $31.97
Orange lines are the previous 24% trade and need to be noted as possible resistance or support.

GME moment of truth -- will the Algo break the trendline??GME algo is in full control, as you can see from the two upward blue channels that follow with a sharp drop.
The good news is that the upward orange trendline has held on 3 separate occasions now -- Feb '21, May '22, and Sep '22.
This signifies that while the algo remains mostly in control, the lows aren't as low as they could be because DRS diamond hands are holding the line.
The moment of truth will come within the next couple weeks, as the algo goes for the "mega drop", similar to what we saw in January when we went from $40 to $20.
If we're lucky, we will mimic the movement of April '20 before the sneeze, where the price temporarily dropped below the trendline and back into it, igniting the squeeze in just a few months.
So I'd expect a quick drop below the channel to the $15-20 range and back into it shortly thereafter.
If this happens, MOASS is most definitely imminent within the next 3 months.
However, if it doesn't bounce back into the channel, MOASS would be delayed and a new trend would most likely take shape over the next 6 months or so before we can make any real judgement. At that point, we'd be totally dependent on DRS numbers sucking out liquidity before we saw anything really reminiscent of MOASS.

$GME - Maybe somethingHi all,
Don't get your hopes high, as of a couple of weeks now GME, XRT and those other basket stocks have been seeing a few swaps with a higher than usual cost. Typically when this happens it means something's going to happen within 5-15 days at least according to me. For example when we were dropping down like a brick to 24, there were no swaps above $1 mil, suddenly since a bit over a week now swaps are picking up a bit with some >$1m swaps indicating a small buildup of something. The amount of $ spend on swaps is not anywhere close to what happened with other runs which might indicate that we're in for a tiny run.
It's a bit unusual for GME to see larger or equal amounts of $ spent on swaps than what is spent on AMC. Again, the amounts aren't insane compared to other runs, but are still indicative of a bump incoming. Please note that random Powel announcements, CPI bs or random intentional scares can always happen and will always be the perfect excuse to just ram the market into the ground on the market's most bullish days and especially Meme Stock run days.
I think the current price action and what's to come is mostly retail (thetagang) dipping their feet in now that they know the quarterly playbook and know when to sell and not sell puts. Another part of it is hopefully last month's settlement being deferred somehow to September like what happened with February 2022 where a tiny run happened but most was deferred to March, that or settlement ocurred during the mega dip of August. Anyway, i think this is mostly thetagang's doing as i've seen them tell each other to wait before selling calls or puts etc which indicates they now understand the playbook and might be affecting everything.
All in all, Sept looks weak for a run. If there is one, i think it'll be weak-ish like $31.4 kind of weak. March seemed weak too and then it blew up, so you never know. Keep that in mind. I don't think anyone expected March to happen and that's why everyone was caught off guard and the price managed to run that high. Will be interesting to see what September does.
Here's some swaps from the past ~5 days ish that are slightly unusual.
-GME $27.62532679 QTY:100,000 Cost:3,000,000, Trade:NEW-Amendment Expiry:2026-11-13 PreviousExecutionDate:2021-11-10 ID:430119421
-GME $27.62532679 QTY:100,000 Cost:3,000,000, Trade:NEW-Amendment Expiry:2026-11-13 PreviousExecutionDate:2021-11-10 ID:428544542
-XRT $67.34842157 QTY:280,000 Cost:19,000,000, Trade:NEW-Amendment Expiry:2032-06-04 PreviousExecutionDate:2022-06-02 ID:428543151
-XRT $100 QTY:30,000 Cost:2,000,000, Trade:NEW-Termination Expiry: PreviousExecutionDate:2021-01-04 ID:428420120
-GME $36.83376914 QTY:120,000 Cost:4,000,000, Trade:NEW-Amendment Expiry:2026-11-13 PreviousExecutionDate:2021-11-10 ID:427892329
-GME $43.86061112 QTY:51,000 Cost:2,000,000, Trade:NEW-Amendment Expiry:2023-01-25 PreviousExecutionDate:2021-12-21 ID:427891743
-GME $19.97363499 QTY:35,000 Cost:1,000,000, Trade:NEW-Termination Expiry:2026-05-28 PreviousExecutionDate:2021-06-01 ID:427790074
-GME $29.69945297 QTY:79,000 Cost:2,000,000, Trade:NEW-Increase Expiry:2023-10-09 PreviousExecutionDate:2022-06-22 ID:426806358
-AMC $15.00000004 QTY:180,000 Cost:3,000,000, Trade:NEW-Trade Expiry:2023-09-07 PreviousExecutionDate:2022-09-07 ID:426517030
-AMC $15.00000004 QTY:180,000 Cost:3,000,000, Trade:CANCEL-Trade Expiry:2023-09-07 PreviousExecutionDate:2022-09-07 ID:426517781
-XHB $999,999,999,999,999.99999 QTY:1,400 Cost:87,000, Trade:NEW-Termination Expiry:2029-07-17 PreviousExecutionDate:2021-11-17 ID:428511808
I only track XHB because it has a strong relationship to XRT and this monstrosity appeared. Hopefully a clerical error.
Anyway if there will be a tiny price bump, it may occur on Wednesday-Thursday next week which is almost exactly 15 days from when some pretty large swaps were filed for KO and BRK.B (The "indicator" stocks)
Really, the larger than normal swaps started being filed starting on the 2'nd of Sept up to the 7'th. So the +15 days window from there starts on the 14'th of Sept to the 23'rd ish for a run.
-KO-COLA $62.00322181 QTY:3,000,000 Cost:170,000,000, Trade:CANCEL-Trade Expiry: PreviousExecutionDate:2022-09-08 ID:426490917
-BRK-B $249,999,999.49352237 QTY:5+ Cost:250,000,000+, Trade:CORRECT-Trade Expiry:2023-07-10 PreviousExecutionDate:2022-09-06 ID:424583559
-BRK-B $249,999,999.85039584 QTY:5+ Cost:250,000,000+, Trade:CORRECT-Trade Expiry:2023-07-10 PreviousExecutionDate:2022-09-06 ID:424584248
-BRK-B $250,000,001.20846061 QTY:5+ Cost:250,000,000+, Trade:CORRECT-Trade Expiry:2023-07-10 PreviousExecutionDate:2022-09-06 ID:424622634
-XRT $66.44628649 QTY:64,000 Cost:4,000,000, Trade:NEW-Increase Expiry:2023-03-02 PreviousExecutionDate:2022-08-16 ID:424624284
-XHB $62.95258534 QTY:95,000 Cost:6,000,000, Trade:NEW-Partialtermination Expiry:2023-01-04 PreviousExecutionDate:2022-08-26 ID:424578934
-XRT $66.66666691 QTY:130,000 Cost:8,000,000, Trade:NEW-Trade Expiry:2023-01-04 PreviousExecutionDate:2022-09-06 ID:424579433
-KO-COLA $45.75033764 QTY:5+ Cost:250,000,000+, Trade:CORRECT-Trade Expiry:2022-10-26 PreviousExecutionDate:2022-07-26 ID:422184202
I'm too poor to play this, but by all means feel free to keep an eye out for it. Not gonna mention the next more significant run date as i don't want thetagang and others to pick up on it, a man needs money...
None of this is financial advice, i'm not a financial advisor.

Revisiting my prior theory on creation of GME FTDs through TTTHello everyone, Chem here..
Earlier this year along with the help of copious amounts of information on Reddit.
I discovered that it is super blatant that
TTT (ProShares Ultra Pro Short),
seemingly spikes strongly into GameStop
run ups.
Overlaying the charts has allowed
me to view and observe perfect symmetry
between the two.
My theory and ideals on this entire topic
stands. If you wish to read my extremely
detailed ideas and rant topics then feel
free to somewhat educate yourself.
Kenny G, ain't no stoppin' me.
Cant stop. Wont stop. GameStop.
Just sold my car for more shares, I bike to
my chemical warehouse job where I work
80 hours a week at. I'Il inhale cancerous
products 24/7 just to fuel GME fractional
amounts if it means cell one day. You give
me power Kenny G. Thanks you
Check out my other great topics about this
same idea.
GME to the moon
Not financial advice.
Also I'm 100% on my calls so far, in terms
of success, if that means anything to you
analytical people.
Further explanation in comments.

GME Potential for Bullish Continuation| 19th September 2022On H4, with the price breaking the descending trendline and Stoch is rising from the support, we have a bullish bias that the price may rise from the buy entry at 29.19, which is in line with the 23.6% fibonacci retracement to the take profit at 31.98, where the overlap resistance and 38.2% fibonacci retracement is. Alternatively, the price may drop to the stop loss at 26.91, where the 50% fibonacci retracement is.
Any opinions, news, research, analyses, prices, other information, or links to third-party sites contained on this website are provided on an "as-is" basis, as general market commentary, and do not constitute investment advice. The market commentary has not been prepared in accordance with legal requirements designed to promote the independence of investment research, and it is therefore not subject to any prohibition on dealing ahead of dissemination. Although this commentary is not produced by an independent source, FXCM takes all sufficient steps to eliminate or prevent any conflicts of interest arising out of the production and dissemination of this communication. The employees of FXCM commit to acting in the clients' best interests and represent their views without misleading, deceiving, or otherwise impairing the clients' ability to make informed investment decisions. For more information about the FXCM's internal organizational and administrative arrangements for the prevention of conflicts, please refer to the Firms' Managing Conflicts Policy. Please ensure that you read and understand our Full Disclaimer and Liability provision concerning the foregoing Information, which can be accessed on the website.

gme and ressessionshello everyone.
a prime time to be bullish for gme, stock split, shares are being taken off the market.
no trade for now i just want to reitterate the gaming industry was -relatively- unharmed durnging the 2008 recession
as for how they have changed thier company and structured themselves over the past few years and into an online retailer,
its time to prove it as wallmart sounds the ressession alarm bells.
no position for now.
tell me what company you would invest in and hold?
www.quiverquant.com
www.quiverquant.com
"aye, ye best start belivin' in the matrix, yer in one."

Analysis-downtrendBreakout with force the vwap indicator so we will have a big probability of a downtrend

GME How Much Upside?NYSE:GME
GME has made a recent move; is there any more left?
On the one hour chart with the volume profile overlaid.
the head and shoulders pattern of late May to late June
may be providing resistance as does the POC of the
volume profile in the same price zone.
I conclude that GME has perhaps 15% upside and is
not setting up a parabolic move or anything of the sort.

GME consolidation patternGME consolidation pattern.
expecting to break downwards.
first trigger rolling over at 36usd.
second trigger losing the red upward support line.
