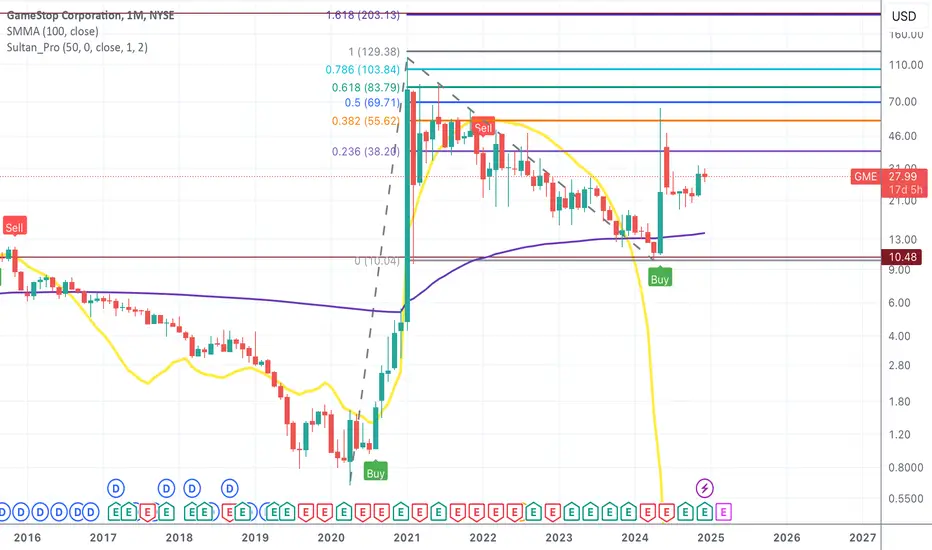
GME - The cat is gone, the mice try to keep the party goingDoing a technical analysis of NYSE:GME might seem idiotic and pointless. We all know price is ruled by Reddits and social media posts. It used to have its moments due to a kitten, with insane movements. The kitten has fled, and the Reddits still claiming this is the best company ever do not have the power to keep the stock up. Management has proven several times they do not care about shareholders, instead they see them as a tool. They have taken advantage of shareholders more than once, and they will again.
Price is now in a kind of limbo, wedge pattern. This will not last. The company has a full bank account, but has not shown or communicated anything about any potential investments. In fact, they have shown signs of trying to save the obsolete business of yesterday by closing some stores. I am fully aware that something must be going on behind the scenes, but it has been a story for some time. NYSE:GME still has the right to issue/sell more a lot of shares, and given their history of totally ignoring and abusing their shareholders, I expect another dilution of shareholders. Continued no news, reduced interest, no hope of the kitten rescue, lower highs on the chart, I feel the lower channel band will be broken and we face the support around $15, then $10. Without RK, and a non-communicating RC there is no case.
GS2C trade ideas

Ascending triangle on the 30-minute chart converging on 01/09.In Roaring Kitty's 'Time You Cover'-tweet, the date 01/09 is prominently displayed. Now, I’ve identified an ascending triangle on the 30-minute chart that converges on the exact same date, 01/09. Whether this is a coincidence or something more, only time will tell.

This demand level may be the last stop for GMEI recently seen an article about Game Stop being at its lowest level of the year so i decided to glance at the technicals. From a Technical standpoint it looks pretty good. Here are a few reasons why i think this:
1) Price is approaching a nicely unmitigated demand zone.
2) The demand zone created a great deal of imbalance
3) There is liquidity above the demand zone.
4) There is divergence playing out.
When price approaches the demand i may look for some calls depending on how momentum shifts on the lower time frams.

Bullish on GMEI was anticipating a nicer looking cup and handle patter here, regardless the direction looks like it wants to be bullish. Nice meaningful higher lows and a break out of a triangle is telling me there's a lot to be optimistic about. Meme stock filled with hopium aside, the chart really looks promising.

GME Next Stop The Moon!!!Needs to break above $32. RSI is still strong above 50 level. Profit target $40 and beyond!!!

$GME is Bullish and targeting $65NYSE:GME has broken out of the $20-$25 range with strong momentum and a rounded bottom on the range. A move above $31 will send this to $48 very swiftly. Ill be updating as the days go

MOASS: WC: 27.99 Target: 1800-2400 MOASS: 47k-100KTLDR:
BOOM!!!
Volume Point of Control (VPOC) is critical to watch as well
VPOC tracks the major waves in the wave cycle and will sit between major waves
VPOC and where it sits in relation to price, like VWAP, helps us track the progression of waves
Next move will take us to the 35-40 region
Price will then retrace back to the 28 region which is where we will see an EXPLOSION IN PRICE
That move back to 28 will be your last time, maybe ever, to get GME at anything near these levels
The next move after the retracement to 28 takes us to 70
After 70 comes CHEERS EVERYBODY!!!

GME - $15 to $180GME probably needs more liquidity in order to make it's next big move. It may need to trap more bears with a quick flush to $10-$15 before ripping to $180.
This may take some time to play out.
*not financial advice*

GME Stock with my own code strategy bullish to highThis is not a financial advisor !!!
I have developed my own code with my own strategy and I notice that the GME has high target 100+ the code give me a buy signal at 15+ and high target. so let us see in the coming weeks
Inverted Head & Shoulders, Cup & Handle, Bull Flag GME DailyHey, everyone. It's that time again for the latest market update on GME. The charts are buzzing with activity, and we have some exciting developments to share.
Currently, we are trading within a substantial Bull Pennant on both the 15-minute and 1-hour charts. This indicates strong consolidation and potential for a significant move upwards. Additionally, we have a Bull Flag on the 4-hour chart, adding to the bullish sentiment.
On the daily timeframe, we've formed an impressive Cup & Handle, an Inverse Head & Shoulders, and a Bull Flag for the handle of the cup. These patterns are powerful indicators of potential upward momentum.
But that's not all! We are also in the midst of a significant Golden Cross on both the daily and weekly charts. This crossover of moving averages is a strong bullish signal, suggesting that we could be on the verge of a major uptrend.
Here’s a detailed technical breakdown:
15-minute chart: Bull Pennant
1-hour chart: Bull Pennant
4-hour chart: Bull Flag
Daily chart: Cup & Handle , Inverse Head & Shoulders , and Bull Flag
Weekly chart: Bull Flag & Golden Cross
For those who are new to these updates, it's worth noting the historical context: The last time GME had a Golden Cross on the weekly chart was back in January 2021. Following that, GME saw an incredible 12,000% run over just 183 trading days.
With the return of the Kitty and all systems go across all timeframes, the stage is set for a potentially explosive movement. Stay tuned and be ready for what promises to be an exhilarating ride.

Upcoming C+35 Calendar Event on January 9-10Here’s a simple visualization showing the C+35 date tied to the December 5th volume spike. If the pattern holds, I’m expecting another spike around January 9-10. My last prediction for October 25th played out as expected, so let’s see if this one does too!

GME levels publicAll levels of GME for you to analyze, was unable to post publically but was done before earnings..see what you think. Fibs used and basic trend lines too.
check twitter/X: Cyqotek --for other ideas...

GME earnings instructional time framesA short instructional video on NYSE:GME and how to trade an earnings in the shorter time frames

GME Earnings happen to be tonight after hours, and unfortunately, the market has been pulling back in some sectors, which is not the best thing for us GME bulls. What I can see so far, is a symmetrical triangle building. We are struggling to clear the $31 area again we got rejected. We have some serious support on the longer term chart but we have to continue to remain above around $28 overall.
The support of the symmetrical triangle is around 2650 area so as long as we continue above that for now we can say this is just building.
We can also pull fib retracements short term from the start of the move around 20.37 and pull it up to the recent top around 32.10
This gives our 50% support still around 26.23. As well as the .382 fib around 27.60
The earnings is about 50% chance of upside or downside. It doesn’t seem like any clear pattern. If we can get some kind of good news, we could potentially see this stock bottom 1-3 days after the earnings report and have a swift move within a week after depending on the news. That seems to be a pattern I have found looking back from the past 3 reports. Hopefully GMe can drop something unexpectedly good and keep this pattern and uptrend alive.
Any large downside moves after earnings we can see a drop to .618 24.86 $ or 23.88 Keeping some buy orders there around time
Of earnings won’t be a bad idea as we may get some low bid fills in anticipation of drop.
Good luck to all taking the risk holding though earnings. And good luck to those looking to scoop up if we get a good drop after.

GameStop Trading Strategy for Next WeekRecent Performance: GameStop has faced significant market volatility, recently
reporting revenue of $887 million, down 17% from $1.08 billion year-over-
year. This reflects considerable challenges in maintaining sales momentum
amidst increased competition and a shifting gaming landscape.
- Key Insights: Investors should pay close attention to GameStop's strategic
initiatives. The company's shift to an online-focused model is crucial but
comes with inherent risks. The projected EPS of -$0.03 suggests ongoing
struggles with profitability, underscoring the need for effective
operational adjustments to attract and retain customers.
- Expert Analysis: Market sentiment among experts remains cautious. While
GameStop's loyal retail base fuels speculative interest, the long-term
outlook could hinge on successful digital expansions and partnerships.
Anticipation of the upcoming earnings report may lead to heightened
volatility, necessitating careful monitoring of price movements.
- Price Targets: Based on recent analysis, next week's targets and stops are
established as follows:
- Next week targets: T1: $32, T2: $34
- Stop levels: S1: $26.50, S2: $25
- News Impact: The upcoming earnings report, scheduled for Tuesday, is
generating notable excitement, with projections and trends underscoring
potential price swings. Broader market conditions, such as regulatory
changes and evolving consumer behavior, will also play critical roles in
shaping GameStop's trading activity in the days ahead.

MOASS: WC: 29.06 Target: 1800-2400 MOASS: 47k-100KTLDR:
-RK Emoji timeline and latest tweets align with our consistent prediction that Jan would see explosive price movement
-Elliott Wave is our guide
-500 area is the next major target area on the way to 1800-2400
-Protect your investment at all costs!
-35-40 area is significant and after we reach it we will see a retracement to the 30ish area and then we should head to 75
-That move to 75 is your first clue that 100K is very possible

Game Since a rejection of $31 GME fell very far down back to the $27 area
I was long at 28.80 and it caught me off guard and stopped me out. However, I am looking back at it again right now, as it’s really really tight in this consolidation, although it’s a bearish move into it, which can be potentially a sign that it could go lower, could also be on several long-term support looking through ping-pong in between the upper resistance in this lower support, which could bring us back to test that 31 area again.
Entry 27.10.
Stop loss break of 26.20
Confirmed hold above 28 could also be entry. Target 30.80$

GameStop Corp. ($GME): High-Risk, High-Reward OpportunityGameStop Corp. ( NYSE:GME ): High-Risk, High-Reward Opportunity
Trade Setup:
- Initial Entry: $31.45
- Alternative Entry: $24.11
- Stop-Loss: $10.88
- Take-Profit: $125.99
Rationale:
GameStop, a prominent video game retailer, has experienced significant volatility, often influenced by retail investor interest and speculative trading. The stock's history includes notable short squeezes, leading to substantial price surges. Recent discussions suggest the potential for another upward movement, presenting a high-risk, high-reward scenario.
Financial Performance:
In Q2 2024, GameStop reported revenue of $798.3 million, down from $1.16 billion the previous year. The company is focusing on cost containment and plans to close underperforming stores to enhance efficiency.
Volume and Short Interest:
As of November 15, 2024, GameStop had approximately 31.87 million shares sold short, representing about 7.47% of the float. This level of short interest indicates a moderate potential for a short squeeze.
Analyst Ratings:
Analyst coverage on GameStop is limited, with some maintaining a "Sell" rating and a price target of $10.00, suggesting potential downside. However, the stock's volatility and retail investor interest can lead to price movements that diverge from analyst expectations.
Risk Management:
Given the stock's volatility, strict adherence to the stop-loss at $10.88 is crucial to manage potential losses. The ambitious take-profit target of $125.99 offers a substantial reward, but traders should be prepared for significant price fluctuations.
*When the Market’s Call, We Stand Tall. Bull or Bear, Just Ride the Wave!*
*Disclaimer: This analysis is for informational purposes only and does not constitute financial advice. Traders should conduct their own due diligence before making investment decisions.*

GME Ready for a Major Move – A Happy Christmas Move?GME recently broke out of a 3-year-old bull flag pattern, encountering strong resistance at the 200-week moving average (often referred to as the "big red"). After rejection at this level, the stock found solid support at the 50-week moving average, which is a bullish signal.
It appears to have formed a bullish pullback and is now beginning to move upward again. The stock briefly paused at the 200-week moving average once more, and now it needs to break through this level with significant momentum.
Once GME breaks above the 200-week moving average, it could trigger a powerful rally, potentially propelling the stock to all-time highs. At that point, it would likely become unstoppable.
The MACD and RSI indicators look bullish and remain far from overbought levels, signaling room for further upward movement.
With $4.5 billion in cash reserves, GME has the potential to become a standout performer in 2025.
Patience is key, as big players rely on retail investors to give up and sell their shares, making it easier for them to cover their positions.

GME is repeating macro cycle? Hypothesis that entire GME cycle is repeating starting from January of 2021 aligning with the summer 2024 run up.

GME Macro Cycle Repeating? The entire cycle may be repeating meaning we'd be waiting until summer for the next big move.

Higher push Price is consolidating for a higher move. Very volatile name. Don’t use option unless you want to lose all your money. Add shares instead.

$GME moon ready. Time to join the WSB degens in buysKey Stats:
Market Cap: $5.2B
P/E Ratio: 25.6 (yeah, that’s rich for retail)
Free Cash Flow: $350M
Next Earnings Date: December 2024 (this could be the hype catalyst)
Short Interest: ~18%
Top 3 Technical Reasons for Bullishness:
1️⃣ GME just broke out above its 200-day moving average.
2️⃣ Bullish divergence on the RSI as buyers sneak back in, flexing on oversold bears.
3️⃣ Volume profile shows strong support meaning this floor is solid.
Top 3 Fundamental Reasons for Bullishness:
1️⃣ GME’s pivot to e-commerce is finally gaining traction—revenue growth at 10% YoY suggests the meme dreams are alive.
2️⃣ Recent insider buying: execs seem to think this is going places.
3️⃣ Console cycle tailwind: With PS5 and Xbox sales rising, their refurbished game model looks golden.
Potential Paths to Profit:
1️⃣ Lowest Risk: Buy shares at current levels and HODL. Target price: $120.
2️⃣ Moderate Risk: Jan 2025 $70 calls ($5–6 premium)—reasonable time for the hype to play out.
3️⃣ High Risk/High Reward: Buy deep OTM $100 calls for July 2025. Cheap lotto tickets.
Disclaimer:
We are not a brokerage or investment firm. We do not offer financial advice or investment advice and/or signals. This is not certified financial education. We offer access to the daily thought process of an individual and his experiences. We do not offer refunds. All sales are final.
