HDI trade ideas


HD Long William Alligator : the stock is currently in a bullish position because the candlesticks are above the Teeth, Lips and Jaw and the lines are “eating with an open mouth” this indicates that the stock is in a strong uptrend.
RSI : the line is under 70, so the stock is not overbought.
Candlestick patterns : there is a bearish engulfing which is a bearish confirmation.
Overall : it can be interesting to take a buy position on this stock because the indicators indicate that the price is increasing. Entry price is higher than the current price for assurance and stop loss is set at -5%.

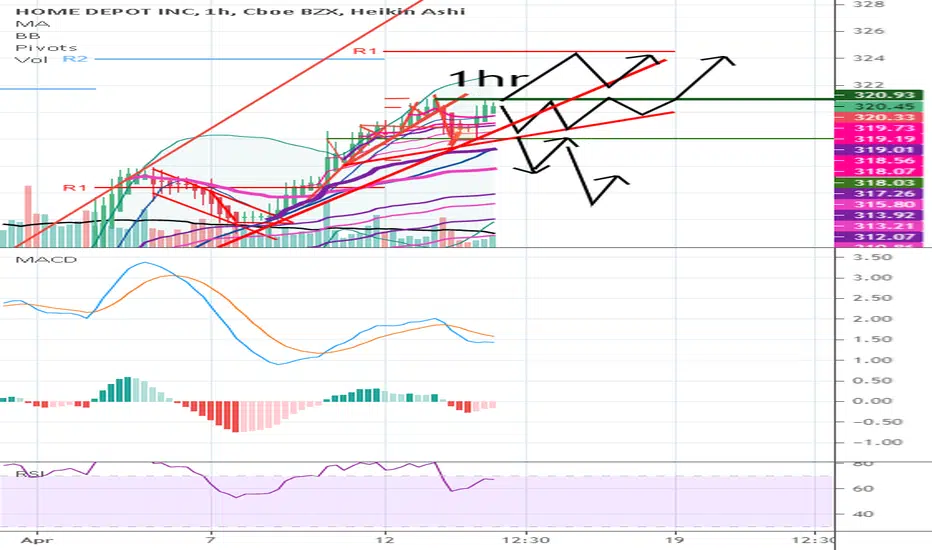
Will Home Depot Decline Before Summer?I am writing this analysis a little after the triggering signal as I watched the stock move up. The red and green boxes still indicate targeted movements (as detailed in prior analysis and below), however, I have looked for potentially stronger entry points for put options. As I previously mention, the stock may continue to move up in contradiction of the reversing signal, but this continued movement is limited. This continued movement based on median statistics (the black dotted arrow) had the stock move upward for an additional 3 days to 327.21. The 3 days was spot on, and so was the peak. The actual peak (assuming the stock continues to move down from this point) was 328.83.
Ideally, the stock is finally obeying the reversal signal from April 14, 2021. The peak occurred in line with historical movement by occurring in the smaller red box. Based on historical movement, the peak could have occurred anywhere in the larger red box. The next targets are in the green boxes. The pending bottom should occur within the larger green box as has been the case on the prior 373 occasions. Half of all movement has ended in the smaller green box. 84.45% of the 373 historical signals have seen the stock price drop at least 1.03% below the closing price on the signal bar. In this instance, the signal indicated SELL on April 14, 2021 with a closing price of 320.02.
If this instance is successful, that means the stock should drop to at least 316.71 which is the top of the larger green box. Three-quarters of all successful signals have the stock drop 3.05% from the signal closing price. This percentage is the top of the smaller green box. Half of all successful signals have the stock drop 6.366% which is the end point of the black dotted arrow. One-quarter of all successful signals have the stock drop 11.189% from the signal closing price which is the bottom of the smaller green box. The maximum decline on record would lead to a drop to the bottom of the larger green box. These are the same concepts for the levels in the red boxes as well.
The ends/vertical sides of the boxes are determined in a similar fashion. The trough of the drop can occur as soon as the next trading bar after signal close, while the max drop occurs within the limit of study at 35 trading bars after the signal. A 1% drop must occur over the next 35 trading bars (days) in order to be considered a success. Three-quarters of successful movement occur after at least 4 trading bars; half occur within 14 trading bars, and one-quarter require at least 26 trading bars.
The black dotted arrow represents median historical movement. Medians are a good metric, but they are just one of many I use when forecasting future movement.
As always, the stock could decline the very next bar after the signal without looking back (therefore the red boxes would not come into play) or the stock may never decline (and the green boxes may never come into play).
All statistics and the full analysis are available for free as always at the site below.

$HD weak close....Alot of strength in this name lately, but diverged from the market into close. On watch for a pull back...

Home Depot should be in your WatchListThere is a macro narrative underway that is wildly bullish for Home Depot.
The fuse being lit here under a MASSIVE bull run evident within the latest WSJ article. Get ready for a flood of improvements and investments in homes. Keep in mind how cash flush consumers are, and how pent up they have been in their homes. The WSJ certainly made the case when they said:
"The estimate represents a 52% rise in the nation’s home shortage compared with 2018, the first time Freddie Mac quantified the shortfall."
“We should have almost four million more housing units if we had kept up with demand the last few years,” Mr. Khater said. “This is what you get when you underbuild for 10 years.”
Housing my friends is about to get red red hot.
www.wsj.com
Let's also take a peek at flatbed capacity folks. Flatbeds provide capacity for the construction sector and massive commodities within the logistics sector. New truck sales are up ...gulp 424% in march!
www.ttnews.com
Demand is wild, but who are going to drive all of these trucks with a driver shortage underway at exactly the same time?
Load postings (loads shippers need transported) are up +129.9% Y/Y
Truck postings (trucks available to haul loads) -6.9% Y/Y
-Stats provided by DAT
Let's drill in a bit further folks! This upcoming ratio is a bit like saying... the average temperature in North America is 70.7 degrees Fahrenheit, or 21.5 degrees Celsius for our friends across the pond. Not very helpful if you are trying to zero in to the Florida market vs the Alaska market. But regardless this data is stunning as the current load-to-truck ratio for flatbed is over 80 loads per trucks. In some very hot markets it is well over 120 loads per truck. Think about what that means! The average driver has over 80 loads to select from before hauling his freight. This enables him to bid himself much higher. Obviously this cost to manufacturers and distributors or even those providing raw goods in lowlier verticals all can not just shoulder this costs - it must get passed on to consumers. Clearly this will result in further inflation pressure. It is stunning if you think of it that Dr Michael Burry predicted that the inflation pressures would be observed initially within supply chains...and yes he nailed it.
Citation of chart displaying Load-to-truck ratio:
www.facebook.com
There are many ways to monetize the current situation. And I recommend a plethora of strategies to diversify risk. And this includes exposure to transportation equity products, building materials, commodities, construction starts, and yes Home Depot.
The final comment I have - and please keep in mind I do not subscribe to political tribalism, I play it monk like focused on how we can be opportunistic in any environment-if Biden passes the infrastructure package again this would lead to a massive supply crunch in many of the areas outlined above. Especially flatbed capacity. Keep in mind flatbed seasonality typically does not kick up until May-June when housing and construction starts are heating up.
As always dear traders if you found this content helpful please be sure to like, share, and perhaps tell me what I may be missing in my content here.
Final content share that is a MUST READ. Manufacturing PMI is at 64.7% ... So for those unfamiliar with what that means if the PMI index is under 50 we are in a state of contraction, growth mode is evident with numbers above 50. A reading of 64.7% is frankly remarkable.
www.ismworld.org
Pivot Points
Bollingers/EMA/Volume
Can you see the trend friends?
Home Depot is great as well because keep in mind on days equities sold off in the broader market, they continued to march higher as well.
Let the roaring 20's commence! And please be sure to follow me on TradingView as I will let you know any helpful content I can find as we navigate through the rest of this decade.
Good fortunes to you dear traders!


$HD Daily RSI of 79....Daily RSI has been over 70 for numerous sessions. Although the daily RSI can remain in overbought conditions, history shows that some potential consolidation may be on the horizon.

HD - Update - 325 could act as resistanceHD - This one has been a nice mover till now but things could start to slow down soon and we might then see a corrective pullback if this 161.8% Fib retracement level acts as resistance.
I don't know how deep the pullback will be once it occurs but better not give up too much of your profits in that case.
You can use the 50EMA or the ATR as a get out signal or at least to reduce your exposure by taking some profits.


HD - Testing Strategic Resistance Hello Traders !
First of all, this is not a professional analysis nor an advice of any kind. I’m only sharing my thoughts.
This week, Home Depot is testing a strategic resistance level, represented by the yellow trendline, at around $314.90. This trendline hasn’t been broken since Sept ’18.
If HD successfully closed above the trendline, then we will have to wait for the confirmation in the next week candle as it has to open and close above the trendline, then HD is bullish again.
Otherwise, it might try to visit 38.2% Fibonacci retracement level at around $288, which happened to previously work as a resistance level in Aug and Oct of 2020, let’s see if it will act as a support as well.
(If you find this beneficial, don’t forget to LIKE).
Happy trading!

Short opportunity!I always try to present the charts in a simple comprehensive format to prevent any confusion.
This is just my technical view, neither a fundamental comment nor a recommendation to trade..!
Please review my track record and calculate the odds for yourself..!
You’re likes and comments encourage me to continue this.
Stay tuned great live stream and quality content videos coming soon..!
Option trading exposes you to a high risk of losing your capital, never invested in any idea more than what you can afford to lose(5%).

If you follow the trend - looks very bearish Zooming out on the weekly you can see the range. And for those that have been around for a few years or more probably see what I see. A pretty bearish pattern forming. No Home Depot is not going to 40 bucks but it will be breaking 200 and then some.


Home depot---> the last breathHD has formed a reversal pattern today with hammer on top with decreased volume indicating bull exahution, also divergence on indicator. I believe it will start to fall from next week
I hope you are enjoying my analysis, ideas here are for entertainment and education these are not trading advice. Dont forget to like , follow me and check my other ideas

Home depot---> started its journey to homeHome depot had a good run when market was red. Now its has started its downward hourney. There is good divergence on indicator as well as increased volume. It should start falling to support level mentioned in my previous chart. Good strategy will be a call credit spread.
Ideas are for education and not trading advice

Short HD; you can do it, I can help.A couple of indicators are showing divergence for the past week or so, as HD has melted up choppily. It needs some relief and is being sustained by erstwhile investors scrambling for a safe investment in a volatile bond market when the banks can't be counted on to manage their risk. I'd suspect that this could continue a little bit, but within the next week or so as the market changes again this should take a pounding.
Note the marked divergences and the weakness of the indicators after we passed the shaded area. Today might well be the double top we need to leg it down.
The way I see it, the weak technical picture hides an interesting scenario; bond yields calm, money flows back into more conditional investments like tech (this will keep happening to a lesser extent everytime yields 'decline' and consolidate) and away from HD. Bond yields increase and the market panics. Bond yields stay the same and people go back to their riskier bets. In all scenarios HD and other builder, stocks decline in the interum. Perhaps they'll pickup before earnings but they need price discovery now.

Home Depot - Done?I am leaning in the side of Home Depot being toast. I will wait for the candles to close and prove it though. Still want to see if it can pop to the 308s or not

home depot -- will return home soonHome depot had a great run when whole market was red. It has finished its 3 week bull run and now has ended in oversold territory. Recently broke a bull flag. Overall trend in home run is long but it will do a pull back soon . Till 291 level and then i am hoping that it will bounce.
I am going to start a call credit spread 21 days ahead, or but a put. I am short term bearish on HD.

One more little push and then implosion Should be ready to topple soon. I am thinking it heads for a retest or March lows from last year in a correction that’s coming. Just pump it a little more boys cause that’s what Wall Street does and then the floor comes out and the new people and kids are like what happened? This is obscene. An investigation needs to be done. Hahaha. No kids. It’s just how the market works.
