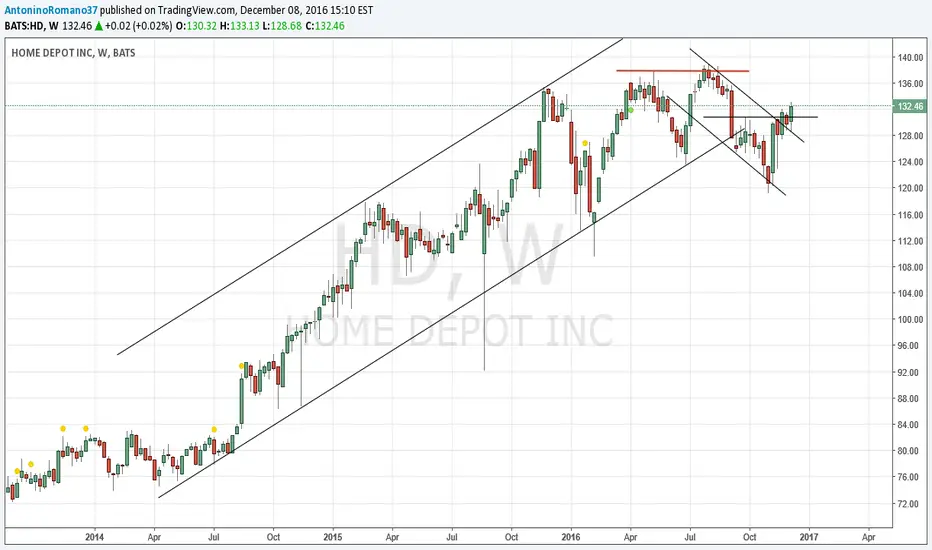
HD: Short the topWe have a good opportunity to take a short here, risk is $5.91 per share, so factor that in when sizing your trade. I'd reccomend 0.5% exposure here. Earning 1.1% per quarter, with a modest 3% free cash flow yield, valuation up here isn't good.
Good luck if shorting it.
Cheers,
Ivan Labrie.
HDI trade ideas


HOME DEPOT HD seems ready to move higher, having digested the last month correction. The long target is around $139
HOME DEPOT ENTERS A BULLISH PHASEHome Depot is drawing an inverted SHS supported by an increasing RSI. Home Depot can gain 10% in the coming days following our algorithmic models.

HD Looking Bearish headed into earningHD tends to sell off coming into earning, so it's not surprise that HD is looking more bearish than bullish with earning in a couple weeks. A close below the 122.01 support look for the retest for possible bearish entry. !22.01 is a strong support on the weekly, but then AGAIN SO WAS 123.50 (NECK LINE ON a triple top on the weekly). Yesterdays bullish candle looks like the retest of that neckline. If you look back to the pink arrows are areas that HD broke down very aggressively, right around the 126 range. My plan is if HD gaps up anywhere under 122.86 I will look for a reversal to the LOD prior day and look for a trade to TGT. IF HD gaps down wait for a retest where the arrow is.
However one candle could make this a decent buying area.


Home Depot - Except Bullish 4 Rest Of 2016"W PATTERNS are call patterns" well "M PATTERNS are put patterns". As you notice on chart with PA two "W patterns with price action pattern. *If you go back on this chart to Oct- Dec 2015- bullish trend happened too. I expect for long term trend to be bullish, with some corrections or retracements along the way. Major support area of 125.00 shows a double bottom pattern now. Remember price action or what is going on right now is key, plus trend trading.


Traying to catch the Flag-BOHome Depot is consolidating the last upmove 123-139 in form of a bullish flag.
Trading below the 38.2 fibo could expand the consolidation


Home Depot "Under Obstruction": Here Are A Dozen Reasons To SellHome-Depot is not under construction, it is "under obstruction" (to near term advances in stock price).
Here are the ONE DOZEN negatives in-Home Depot, and why I feel this stock is a sell:
1. Sell Fractal in effect (red rectangle on chart).
2. Alligator jaws opened in tandem with sell Fractal. Alligator feeding in down-trend.
3. Chop indicator (under chart) is below the 38.2 shaded area. This indicates a strong trend coming that (in this case) is down.
4. Phase energy (lower top indicator) is heading LOWER. The action is below the zero line.
5. Momentum (middle top indicator) is the 5/34 measure, and this is a bearish cross and is heading lower. Histogram within is also heading lower.
6. Prices are trading below the Ichimoku Cloud .
8. Prices are trading below the Ki jun-Sen baseline of the Ichimoku Cloud. This is a sell signal.
9. Prices are trading below the thick red Ichimoku Cloud conversion line. This is a sell signal.
9. The red Ichimoku Cloud conversion line direction is heading lower. This is a sell signal.
10. The Ki jun-Sen baseline of the Ichimoku Cloud direction is heading lower. This is a sell signal.
11. The CHOP ZONE indicator (under chart) is red, indicating a down trend.
12. RSI/ Stochastic (top) is heading lower after a bearish cross.
In my opinion-HD is heading LOWER. I have given you a dozen negative signs as my objective evidence.
Good luck to you in all your trades. Don.

Cautious buyI am very cautious this close to the top and thinking the economy will be heading much lower in the coming months BUT this is such a great company. They are very strong and going into a horrible storm season I think we will see some great profits. I won't be putting much into this being my outlook and it's close to the all time highs but it is a good buy non-the-less.

HD about to roll over HD forming a wedge pattern; reject on the top trend line, should fall and find support at the bottom trend line.


top of cloud short watch close below 50 ma/same store sales baddiversify with long micro cap and short/retail maturing/rsi weak/money flow bad/macd and stoic about to cross/weak group/


Home Depot losing strengthHome Depot recently broke its short-term support of 132.09 and a bearish divergence appeared on the weekly chart. This presents a good shorting opportunity with little risk.
The long-term trend is still up so cover if it breaks out past 138. 5/26 after close


Home Depot Looking Overvalued I am short this one it is in overvalued condition with rejection from top.
