HIMS 1D — This pattern didn’t cook for nothingOn the daily chart of Hims & Hers Health, we’re looking at a textbook cup with handle formation — not just a pattern, but a structure backed by time, volume, and classic price behavior. The base of the cup formed steadily from February to May 2025, and as soon as the curve was complete, price transitioned into a tight consolidation — the "handle" that often masks real accumulation.
Right now, price is testing the resistance area. And it’s not just floating up there — it’s coming in hot: price has already broken through EMA 20/50/100/200 and SMA 50/200. That’s a full stack flip. This isn’t sideways noise — it’s a structural shift in control.
Volume is starting to build as price rises, confirming that demand is real and institutional positioning likely active. We’re watching a breakout zone above the handle — and when that breaks, the structure unlocks with a clear target: $107.25, roughly a 2x move from current levels.
This setup isn’t noise. It’s a long-cooked formation that’s now about to boil over. If the handle holds and price breaks through — the rest is just follow-through.
HIMS trade ideas

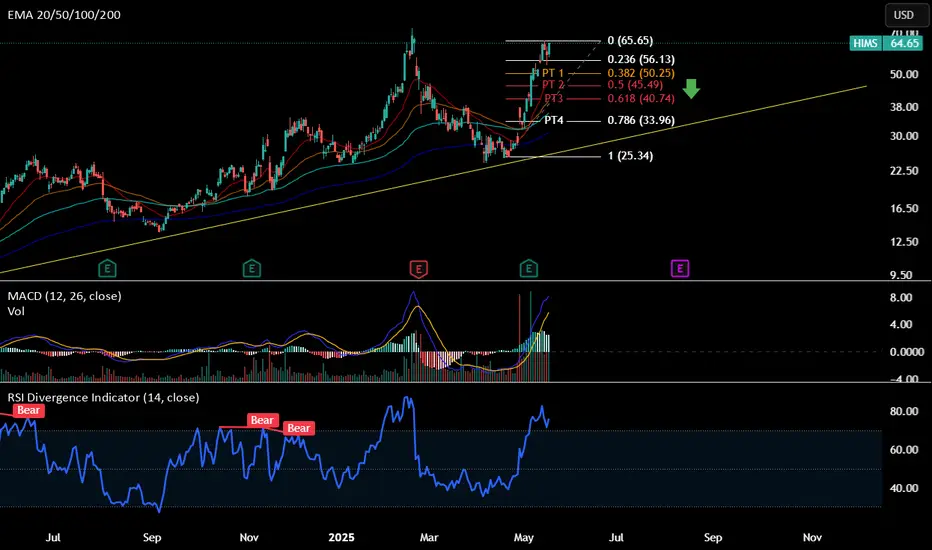
Short - HIMSLong-term trend line: Rising trend line -> short-term bearish due to expected trend line retest (yellow trend line)
Daily MACD & RSI : Overbought -> expect a pull back
Support Line to enter PUT: ~$54
Expected time zone for pullback: 30 days to 50 days
PT1: ~50.25
PT2: ~45.49
PT3: ~40.74
PT4: ~34.96
Possible PT5: expect to cross down the EMA 200 at ~$27, which is close to the trendline support. However, I'll exit all play at PT4.
HIMS Weekly Options Outlook — June 3, 2025📉 HIMS Weekly Options Outlook — June 3, 2025
🚨 AI Model Consensus: Moderately Bearish into June 6 Expiry
🧠 Model Overview
🔹 Grok (xAI)
Bias: Neutral
Setup: Bearish short-term, bullish long-term; mixed outlook
Trade: No action — lacks edge
Confidence: 35%
🔹 Claude (Anthropic)
Bias: Moderately Bearish
Setup: Below EMAs, bearish MACD; cautious sentiment
Trade: Buy $52P @ $0.94 → PT $1.88+, SL $0.56
Confidence: 72%
🔹 Llama (Meta)
Bias: Moderately Bearish
Setup: Post-run fractal pullback, mixed but leaning down
Trade: Buy $52P → PT +20%, SL −50%
Confidence: 70%
🔹 Gemini (Google)
Bias: Moderately Bearish
Setup: Clean break under EMAs, MACD/RSI confirm weakness
Trade: Buy $50P @ ~$0.47 → PT 100%, SL 50%
Confidence: 65%
🔹 DeepSeek
Bias: Moderately Bearish
Setup: Breakdown across timeframes; skewed put flow
Trade: Buy $50P @ $0.45 → PT $0.70, SL $0.32
Confidence: 65%
✅ Consensus Summary
📉 4 of 5 models recommend bearish weekly puts
🔻 Clear breakdown under EMAs with supportive MACD/RSI signals
🧲 Max Pain at $55 could cause late-week pullback or stall
🎯 Preferred strategy: OTM naked puts with high ROI potential
🎯 Recommended Trade Setup
💡 Strategy: Weekly Bearish Put Play
🔘 Ticker: HIMS
📉 Direction: PUT
🎯 Strike: $52
💵 Entry: $0.94 (ask)
🎯 Profit Target: $1.70 (+80%)
🛑 Stop Loss: $0.56 (−40%)
📏 Size: 1 contract
📅 Expiry: 2025-06-06
⏰ Entry Timing: Market Open
📈 Confidence: 70%
⚠️ Risk Factors to Watch
🧲 Max pain at $55 could slow breakdown or cause snapback
🔻 $52 support zone may cause consolidation or chop
📉 Falling VIX = compressed premiums, slower option movement
⌛ Theta accelerates into Thursday/Friday — exit early if flat

HIMS Corrective Wave PullbackLooks like HIMS started its corrective wave pull back. The MACD is about to cross the signal to finish wave B, it most likely will close the gap above. Then I expect it to pull back to around the .5 & .618 fib around $40-45 range where I also there is confluence with the AVWAP from the April 7 pivot around $45. I plan to add in this range before the next leg up.

Safe Entry Zone HIMSAfter reaching the Target with 150% profit.
Now the Blue Zone IC Zone(Interesting Zone or Institutional Candles Zone) is most appealing support level where we wait for Potentional of Strong Buyers to Step In.
Note: Potentional of Strong Buying Zone:
We have two scenarios must happen at The Mentioned Zone:
Scenarios One: strong buying volume with reversal Candle.
Scenarios Two: Fake Break-Out of The Buying Zone.
Both indicate buyers stepping in strongly. NEVER Join in unless one showed up.
Take Care.

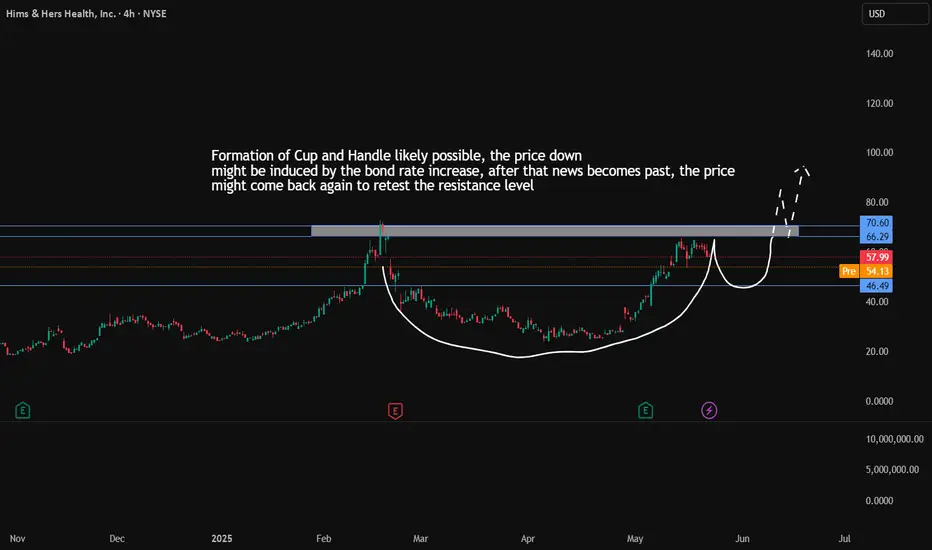
HIMS cup and handle possible.These price actions can occur in NYSE:HIMS in coming days:
- CUP and HANDLE
- Resistance of $66 level can be broken with volume
- Retracement at FIB 0.5 of price $53.6 is less likely, but possible
- Retracement at the resistance level after a break would be good zone for some action
Fundamentals:
- Revenue and net income has increased massively compared to Q1 '24 of Q1 '25.
Safe and Confident Entry ZoneStock reached resistance and rejected with fake break-out.
The stock targeting the green 4h zone.
Note: Potentional of Strong Buying Zone:
We have two scenarios must happen at The Mentioned Zone:
Scenarios One: strong buying volume with reversal Candle.
Scenarios Two: Fake Break-Out of The Buying Zone.
Both indicate buyers stepping in strongly. NEVER Join in unless one showed up.
Take Care.

Hims is OVERBOUGHT Market Context ✨
NYSE:HIMS | Current Price: $42.00
1-Month Move: +17.5% (from $35.75)
1-Year Move: +68.2% (from $25.00)
Year High/Low: $43.50/$24.80
Technicals
RSI: ~75.8 (overbought )
Moving Averages: Above 20-day, 50-day, and 200-day MAs (strong uptrend, but overextended )
MACD: Bearish divergence forming (momentum fading, potential reversal )
Trade Setup
Direction: PUT
Entry Price: $42.00
Take Profit 1 (TP1): $36.00 (~14.3% gain )
Take Profit 2 (TP2): $30.00 (~28.6% gain )
Expected Move: ~12–15% downward
Best AI Signals on the market

$HIMS ONCE IN A LIFETIME FIBONACCI HARMONICNYSE:HIMS ONCE IN A LIFETIME FIBONACCI HARMONIC The 618 29.56 ENTRY was SPOT ON!
It's NOT DONE yet we are gave yall a NICE 10% POP on FRIDAY
Looking for the next dip buy setup here before ALL TIME HIGHS
Will alert here no charge drop a LIKE for me LETS GO

Hims set to correctHims is pulling yet another amazing short squeeze. The stock has become my largest position by far since I got in back around 7$. These supply and demand zones have been drawn for a while. Note the amazing consolidation and push from the green demand box. 73$ would be double top mode. While I love the fundamentals I am not sure if the stock sis worth 70$ until we see next earnings which shouldn't be amazing because of their stated margin decreases, the market will panic like it always does. I would LOVE a retest of 35$, but 45$ is more likely.

HIMS – Pullback Opportunity After Massive RunHIMS has been one of the hottest stocks in the market recently, with a massive run fueled by strong earnings. But now we’re seeing the first meaningful pullback — and this could be a golden opportunity:
🔹 Earnings Gap Reversal (Bullish Signal)
Despite an earnings gap down, buyers stepped in aggressively, pushing the stock higher.
This is a classic earnings gap down reversal — a strong sign of demand.
🔹 First Pullback Opportunity
Historically, the first pullback after a major run tends to get bought.
I’m watching two key levels for a potential buy:
The shaded zone between the 9 EMA and 20 EMA (dynamic support).
The 0.38 - 0.50 Fibonacci retracement for added confirmation.
🔹 My Trading Plan:
1️⃣ Initial Entry: Starter position in the shaded EMA zone (9 EMA - 20 EMA).
2️⃣ Confirmation Add: If price bounces off the Fib zone (0.38 - 0.50) with strength.
3️⃣ Stop Loss: Below the 20 EMA for any initial position — keeping risk tight.
🔹 Why This Setup is Compelling:
Strong run + earnings reversal shows real buyer interest.
First pullback after a big run is typically a strong buying opportunity.
The dual confluence of EMAs + Fibonacci enhances this setup.
⚠️ Risk Management: Tight stop below 20 EMA — always control risk.

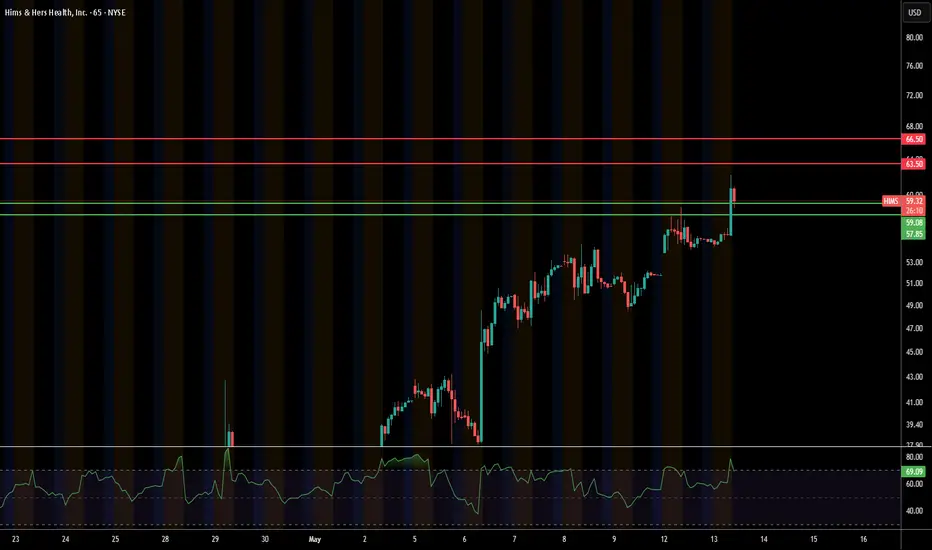
HIMS backtest of level for callsHIMS way oversold on daily and 4hr chart. retest and hold of $61 is good spot for calls to cool RSI off and a move up to $65

trend seems obviousHims retesting lower level and looking higher. Once at top of range i will sell some covered calls to lock in some profit. I'm up more than 100% on my trade at this point, if you follow me you know.
AbidingFrom previously drawn fibs, we see price action abiding to support and resistance levels. As it breaks out of the low range it tests $41 level. Textbook breakthrough resistance
HIMS: More Upside IMO but let's Review All ScenariosBullish Scenario
If HIMS continues higher, we may see a shallow pullback first, possibly around 46.75, which lines up with one of my key levels and the uptrend line drawn from late April.
A slightly deeper dip into the 10EMA would also be a healthy reset.
From there, a move back through last week’s high and a continuation up along the uptrend line would confirm strength and keep this breakout intact.
If momentum holds, I’m watching for a move toward 65, which sits just below the all-time high. This area could act as resistance, gearing up to establish a new ATH.
If we get a new ATH, I’d could see the momentum gain to the upside from the excitement, then an immediate period of digestion, either sideways or a decline as buyers take profits.
Neutral Scenario
A sideways range around the current zone would be healthy digestion after the recent run.
This could look like price holding between the retest levels (roughly 52–56), bouncing in a tight range as momentum resets.
In this case, I’d watch for signs of strength on dips and whether volume dries up during consolidation.
Bearish Scenario
If HIMS breaks below 46.75, it could open the door for more downside, especially if sellers step in and follow through.
That level is still above the EMAs, so the structure wouldn’t shift significantly unless price dips below the 10EMA and 20EMA.
If that happens, I’d watch the 38 zone as the next key support, a previous base where price could stabilize or build a new setup. Below that, it could decline further around 33, where the first uptrend line and gap up was established (which also lines up with the 50SMA).

Simple, Hims20 SMA crossing, High Volume, 33% short bear thesis (That novo would sue them) Is gone, Amazon risk gone, not "Expensive" gave a good 2030 guidance.

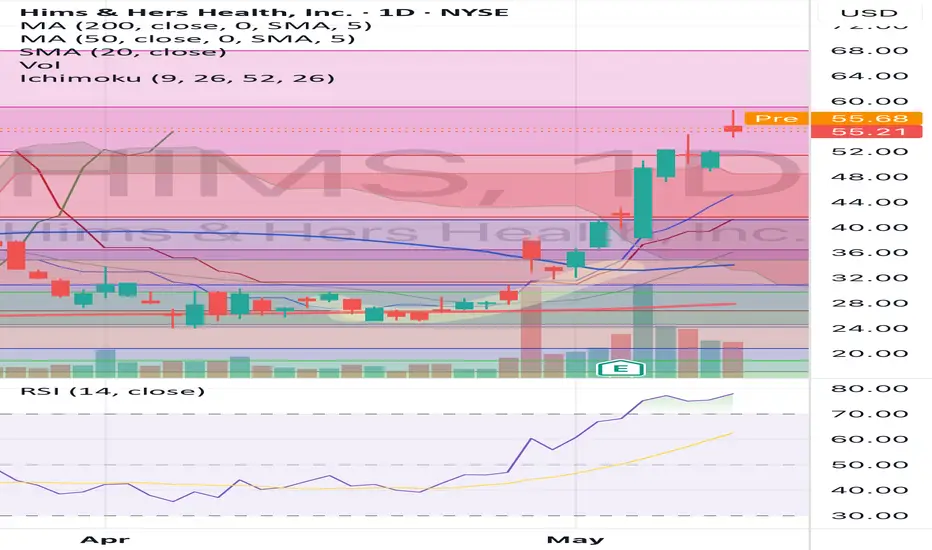
HIMS – Bullish Breakout Above Ichimoku CloudHIMS has broken above the Ichimoku cloud with strong volume, signaling bullish continuation. Key resistance lies ahead at $67–$73. A daily close above this zone could trigger a major upside move. Watching closely for follow-through and retest setups.
I’m entering at the current price ($52.35) with the following setup:
Entry: $52.35
Stop Loss: $48
Target: $66
Risk–Reward: ~1:3.4
NYSE:HIMS
Looking for continuation toward the resistance zone near $66. Will watch for volume confirmation and price holding above the cloud.
#HIMS #IchimokuBreakout #SwingTrade #TechnicalAnalysis #MomentumPlay

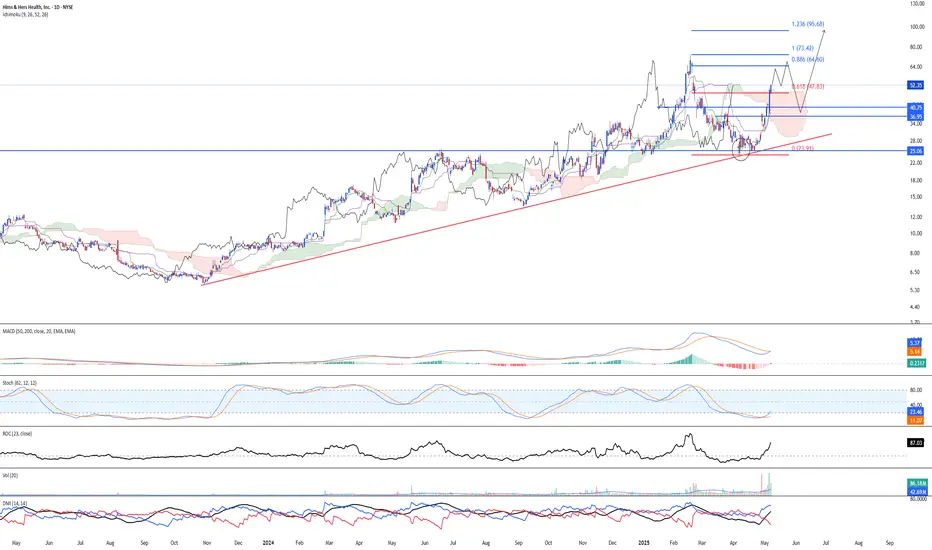
HIMS - Upside going on for a long-term NYSE:HIMS looking at a continued bullish uptrend after the stock has rebounded at 25.06 major resistance turned support. Furthermore, Long-term MACD is looking at renewed bullish momentum after histogram just turned positive. Next, Stochastic is showing clear oversold signal and high volume is back in action.
We believe that the stock may edge higher towards 64.04. We believe that clear stronger support is at 40.75 and 39.65. Major target is at 95.68 and 146.82
$HIMS is in a livermore pattern This Livermore pattern is playing out great. 1.618 will be big resistance tho

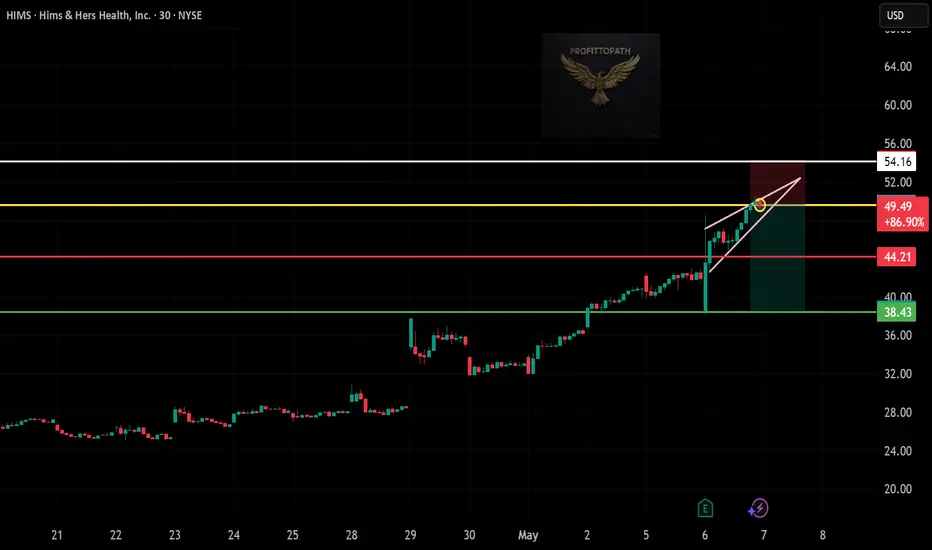
Short Trade Setup – HIMS!📉
🔹 Asset: Hims & Hers Health, Inc. (NYSE: HIMS)
🔹 Timeframe: 30-Minute Chart
🔹 Setup Type: Rising Wedge Breakdown
📌 Trade Plan (Short Position)
✅ Entry Zone: Below $49.49 (Breakdown confirmation)
✅ Stop-Loss (SL): Above $54.16 (Invalidation / top of wedge)
🎯 Take Profit Targets:
📌 TP1: $44.21 – Minor support
📌 TP2: $38.43 – Measured move target
📊 Risk-Reward Calculation
📉 Risk: $54.16 - $49.49 = $4.67
📈 Reward to TP1: $49.49 - $44.21 = $5.28 → 1:1.1 R/R
📈 Reward to TP2: $49.49 - $38.43 = $11.06 → 1:2.37 R/R ✅
🔍 Technical Highlights:
📌 Clean rising wedge pattern
📌 Bearish rejection from yellow zone
📌 Breakdown with retest at trendline
📌 Price struggling to stay above breakout highs
📉 Execution Strategy:
📊 Wait for solid breakdown candle below $49.49
📉 Move stop to breakeven after TP1
💰 Book partial profits at TP1, let rest run to TP2
🚨 Invalidation Risk:
❌ Exit if price pushes above $54.16
❌ Confirm breakdown with volume for clean entry
🚀 Final Take
✔ Rising wedge breakdown confirmed
✔ Bearish setup with good R:R
✔ Trade smart, manage risk — and execute with discipline
HIMS Bulish stanceHIMS Breakout of Parallel channel, testing Fib 0.5 , correction may happen with support of parallel channel on 42 my S.L will be 40 and TP1 54 & TP2 68.

$HIMS is HIMS! 80% Upside AheadNYSE:HIMS is HIMS! 80% Upside Ahead
Demolished earnings and I have this name at a fair value of $76 per share based on HIMS 2030 $6.5B Rev. Guidance.
Also, H5_L Indicator is about to cross bullish while the Wr% is rising and swinging from green to red!
Profit Targets:
- $50
- $60
- ATHs!
Before EOY!
Not financial Advice

45$I know they have some issues with the glp1 one stuff but revenues are strong and this won't matter long term I think everyone knows that. They'll beat earnings next week and we're headed to 35 range I grabbed a bunch of cheap 45 7/18 calls along with some 40 41s. 31% short Interest right now I'm sure we can get a run up to that 35 before earnings. expect volatility both ways. Today had a premature break out ran 7% and came all the way back to negative to retest, falling below trendline will likely invalidate.
