HIMS: how I charted this + bullish/bearish/neutral scenarios! Bullish
A break and hold above the 20EMA would shift momentum back to the upside.
Initial resistance would be around 30, where previous price congestion sits.
If buyers can push through, next target would be around 35–36, near the declining 50SMA.
There is a short-term intraday trendline forming on the hourly chart that could act as a support guide if the stock starts climbing.
Bearish
A rejection from the downtrend line or failure to hold above the 20EMA could lead to a move lower.
Breaking below the 24–25 support area would be a key bearish trigger.
If that level fails, the next major downside target would be near 19.5.
Neutral
Continued sideways chop around the moving averages.
HIMS trade ideas

HIMS viewHIMS weekly view, Horizontal & Trend line support, expecting Right shoulder from here. ( looking 23% upside from here easy target will be 34-34.5$

HIMS higher RR Hello,
Technical prespective only:
Equal Low of the Bullish Breaker, as long it holds the channel is valid and we could see higher prices towards the algotargets (red), if the price dips then i'll be adding more to the bag.
NFA


Quantum's HIMS Trading Guide 4/10/25 HIMS (Hims & Hers Health, Inc.) - Sector: Healthcare (Telehealth)
Sentiment: Bullish. Post-close call volume steady, RSI ~58 (up from ~55), Amplified GLP-1 demand—speculation persists despite tariff noise.
Tariff Impact: Minimal. Domestic focus shields HIMS; 104% China tariffs irrelevant unless generics supply tightens.
News/Catalysts:
Current: tariff pause softens market fear.
Upcoming: Retail Sales (April 15)—strong data could lift +5%; Fed rate outlook (May 2025)—cut signals might push +7%.
Technical Setup:
--Weekly Chart:
---HVN $30 (resistance), support ~$25.45.
---Uptrend (8-week EMA > 13-week > 48-week).
---RSI ~58, MACD above signal,
---Bollinger Bands upper band,
---Donchian Channels above midline,
---Williams %R -25.
--One-Hour Chart:
---Support $28.50, resistance $29.50.
---RSI ~60,
---MACD above signal,
---Bollinger Bands upper band,
---Donchian Channels above midline,
---Williams %R -20.
--10-Minute Chart:
---8/13/48 EMAs up,
---RSI ~62,
---MACD rising.
Options Data:
--GEX: Bullish—pinning near $29.
--DEX: Bullish—call delta dominates.
--IV: High—~50–55% vs. norm 45–50%.
--OI: Call-heavy—above $29.
Timeframe Analysis:
---Weekly: OI call-heavy (70% calls at $30), IV high (55%)—bullish, speculative push.
---Monthly: OI call-leaning (65% calls at $30–$32), IV moderate (50%)—bullish trend.
---3-Month: OI call-heavy (75% calls at $32), IV moderate (45%)—bullish long-term.
Directional Bias:
---Bullish. GEX/DEX and call OI signal strong upside; high IV fuels volatility—intraday breakout potential.
Sympathy Plays:
---TDOC rises with HIMS; AMWL gains with HIMS.
---Opposite: HIMS rallies → WMT fades.
Sector Positioning with RRG: Leading Quadrant (Healthcare vs. XLV)—growth persists.
Targets: Bullish +6% ($30.77); Bearish -3% ($28.16).

HIMS – 30-Min Long Setup!📈
🔹 Ticker: HIMS (NYSE)
🔹 Timeframe: 30-Min
🔹 Setup Type: Falling Trendline Break + Support Bounce
🔸 Price at Breakout: ~$29.55
📊 Trade Plan (Long Position)
✅ Entry Zone: $29.50–$30.00 (breakout above yellow zone + trendline break)
✅ Stop Loss (SL): Below $28.50 (white support line & structure low)
✅ Take Profit Targets:
📌 TP1: $30.84 (red line – supply zone / resistance)
📌 TP2: $32.64 (green line – previous high / major resistance)
📐 Risk-Reward Calculation
📉 Risk per Share:
$29.55 - $28.50 = $1.05
📈 Reward to TP1:
$30.84 - $29.55 = $1.29 → 1.22:1 R/R
📈 Reward to TP2:
$32.64 - $29.55 = $3.09 → 2.94:1 R/R
📊 Technical Confluence
📌 Falling Trendline Break: Clean break of bearish structure (pink line)
📌 Support Bounce: Solid bounce from yellow demand zone
📌 Volume Consideration: Look for rising volume on breakout
📌 Retest Reaction: Entry confirmation if price holds above yellow zone
⚙️ Execution & Trade Management
🔄 After TP1 Hit:
— Move SL to breakeven
— Book 50% profits
🚀 Let the rest ride to TP2
📉 Trail SL below higher lows as price moves
⚠️ Invalidation Criteria
❌ Close below $28.50
❌ Breakout fails with weak momentum or volume
❌ Fakeout candle closes back inside the trendline
🦅 Final Thoughts
✔ Clean reversal pattern forming
✔ Trendline break with structure support = high-probability setup
✔ Favorable R/R and manageable risk

Hims buying opportunity comingPrice action looks like it wants to test support levels much lower than this. Around $32-$28 would be a good area to add if you're looking to get more into hims stock. I have a pretty large position and would only be interested if we get the the lower green support levels. If not, let it ride.

$HIMS - support $31 -30 needs to holdHIMS - stock about to retest $30-$31 support area. if fails here we can see $25 and lower. Stock has not seen momentum coming its way. with lot of call selling. Looking for puts below that level.

HIMS had a fake-out upwards, now fake-out downwards next?As provided in the Title. We are currently breaking out of a wedge on LTF. But on HTF NYSE:HIMS is also forming a wedge. So I'm looking at an ABC scenario down to the marked area.

Hims & Hers Health, Inc. (HIMS) – 30-Min Short Trade Setup !📉🚨
🔹 Asset: HIMS – NYSE
🔹 Timeframe: 30-Min Chart
🔹 Setup Type: Rising Trendline Breakdown & Rejection at Resistance
📊 Trade Plan (Short Position)
✅ Entry Zone: Below $37.42 (Breakdown Confirmation)
✅ Stop-Loss (SL): Above $39.83 (Double Resistance & False Breakout Zone)
🎯 Take Profit Targets:
📌 TP1: $34.98 (Major Support Zone)
📌 TP2: $32.16 (Previous Demand/Consolidation Area)
📊 Risk-Reward Ratio Calculation:
📉 Risk (SL Distance):
$39.83 - $37.42 = $2.41 risk per share
📈 Reward to TP1:
$37.42 - $34.98 = $2.44 (1.01:1 R/R)
📈 Reward to TP2:
$37.42 - $32.16 = $5.26 (2.18:1 R/R)
🔍 Technical Analysis & Strategy
📌 Trendline Breakdown Setup: Price broke below a sharp rising trendline after rejection near horizontal resistance.
📌 Bearish Rejection at $38.00–$39.83: Strong seller zone with historical resistance.
📌 Bearish Candlestick Confirmation: Wait for a 30-min close below $37.42 with solid bearish volume for entry.
📌 Confluence at $34.98: Strong support from previous price structure.
⚙️ Trade Execution & Risk Management
📊 Volume Confirmation: Confirm selling volume on breakdown below $37.42.
📉 Trailing Stop Strategy: Move SL to break-even ($37.42) once TP1 ($34.98) is hit.
💰 Partial Profit Booking Strategy:
✔ Book 50% profits at TP1 ($34.98), let rest ride to TP2 ($32.16).
✔ Adjust SL to entry after TP1 is reached to protect capital.
⚠️ Breakdown Failure Risk
❌ Avoid early entry; wait for confirmation.
❌ If price holds above $37.42 and reclaims trendline, setup invalidates.
🚨 Final Thoughts
✔ Bearish rejection and trendline break signal a possible reversal.
✔ Clean 2.18:1 R/R toward TP2 – attractive short opportunity.
✔ Stick to plan, wait for confirmation, and manage risk accordingly.
🔗 #HIMS #NYSE #ShortTrade #TrendlineBreak #SwingTrading #ProfittoPath 📉📊

$HIMS Hair, Health, Hello!I guess I might be jumping on the Bandwagon. Everything is growing with this one! Year over yr it's exploding, will this have a Zoom like fall? or a Monster rally? Time will tell and the dip makes this look like a great to start loading up.
Very Confident and safe Entry ZoneStock reached the resistance with reject candle indicating continuing down movement.
The stock targeting the green 4h zone.
for confirmation we need to see reversal candle with buying volume once showed up its green light for safe entry.
Don't be caught during the run down movement be safe !
and of course its insane to buy at current level at resistance.
Take Care.

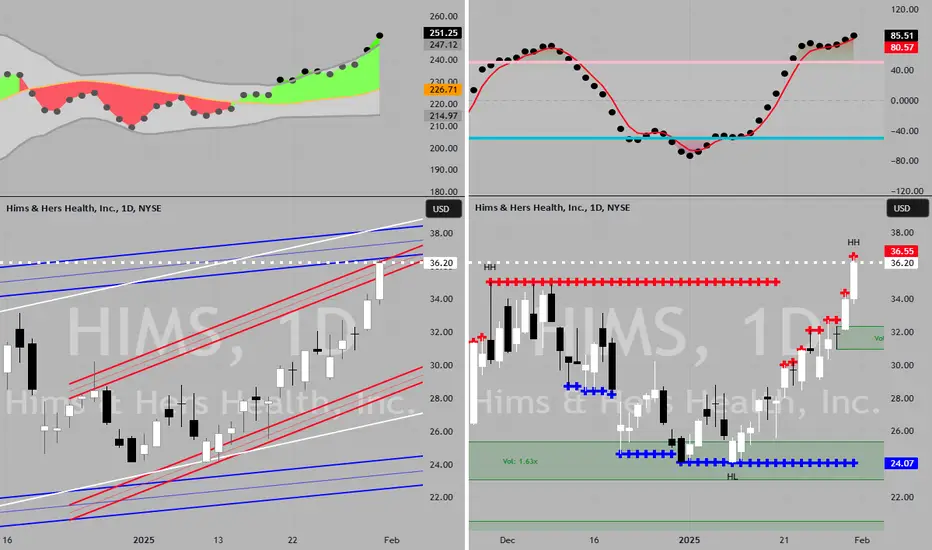
HIMS to $30My trading plan is very simple.
I buy or sell when price tags the top or bottom of parallel channels.
I confirm when price hits Fibonacci levels.
So...
Here's why I'm picking this symbol to do the thing.
Price at top of channels (period 100 52 & 26)
Stochastic Momentum Index (SMI) at overbought level
VBSM is spiked positive and over top of Bollinger Band
Entry at $36.25
Target is $30 or channel bottom
$HIMS - It is not done yetNYSE:HIMS I still think it could revisit that trendline. It is not even close to oversold. $24 is possible. 👀

HIMS (lift off detected) HIMS as sitting above a trend line that been solid since 2023, hitting the 61.8% on fib retracement. Looking positive on 4h relative strength as well as macd. HUGE POTENTIAL!!

Hims perfect golden pocket on monthlyHims has entered the deep value zone after a blow off top on irrational markets. I was able to roll covered calls way up and out due to this and collect ~18k on my shares. I have since rolled backwards and lower to capture my premiums. I believe the bottom is in on this move, and I find it very interesting that Hims fell perfectly to the golden fib.
My plan:
I am going to sell covered calls on the next major pump when the stock is closer to 40$ I did trim some shares to buy hood since that 20% down day was obnoxious

$HIMSHims still looking very bullish. Let's remember to zoom out sometimes and look at the bigger picture. Calls placed for August

Where is $HIMS going next? Massive upsideWhere is NYSE:HIMS going next? Massive upside
Watch now to find out!
Not financial advice


HIMS, what should you do now?Having as a background the video that I just shared about the SPX and the chance that we are in a controlled correction as opposed to a healthy pullback, I am raising stop losses in all my positions. Here's an example with HIMS.

HIMS - The Full MonthyNo, no weed involved in this analysis.
As I said before, sometimes chart analysis is simple. But sometimes we need to extend it, combining all our knowledge to find the facts.
Let's see what we have here:
1. The white Fork.
...it's crazy, isn't it? ;-)
It looks like I was looking to fit it somehow.
But the truth can't be farther away. If you understand the principles behind this tool, WHAT it really measures, and what INFORMATION it really provides, then you get it, why this Fork is drawn like it is.
For the non Forkers:
a) Forks measure extremes, cut swings in upper, lower extremes and show where the center is.
b) they project the most probable path of price.
The A-Point was the old high.
The B-Point was the lowest low.
The C-Point is, where we had the last low, after the High was breached. So, in essence, it's a very stretched Pullback-Fork.
2. The slanted grey lines:
They just bring the natural Swings to light, and project them into the future. That's it.
I'm not going into the the minor drawings here, since they are self explaining. Just give yourself a little bit time, watch the Chart from a distance, and let your thoughts flow.
Any trades here?
Let's observe and trade from one extreme to the Center and beyond...

HIMS/USD – 30-Min Long Trade Setup !📌🚀
🔹 Asset: HIMS (Hims & Hers Health, Inc.)
🔹 Timeframe: 30-Min Chart
🔹 Setup Type: Bullish Breakout Trade
📌 Trade Plan (Long Position)
✅ Entry Zone: Above $41.80 (Breakout Confirmation)
✅ Stop-Loss (SL): Below $36.03 (Support Breakdown)
🎯 Take Profit Targets:
📌 TP1: $50.32 (First Resistance Level)
📌 TP2: $60.38 (Extended Bullish Move)
📊 Risk-Reward Ratio Calculation
📈 Risk (SL Distance): $41.80 - $36.03 = $5.77 risk per share
📈 Reward to TP1: $50.32 - $41.80 = $8.52 (1:1.47 R/R)
📈 Reward to TP2: $60.38 - $41.80 = $18.58 (1:3.22 R/R)
🔍 Technical Analysis & Strategy
📌 Triangle Breakout: Price is forming a bullish wedge, indicating possible breakout above resistance.
📌 Bullish Momentum Building: A breakout above $41.80 with strong volume will confirm upward movement.
📌 Volume Confirmation Needed: Ensure high volume at breakout to confirm buying pressure.
📌 Momentum Shift Expected: If price sustains above $41.80, a move toward $50.32 and then $60.38 is likely.
📊 Key Support & Resistance Levels
🟢 $36.03 – Strong Support / Stop-Loss Level
🟡 $41.80 – Entry / Breakout Level
🔴 $50.32 – First Resistance / TP1
🟢 $60.38 – Final Target / TP2
📉 Trade Execution & Risk Management
📊 Volume Confirmation: Ensure strong buying volume above $41.80 before entering.
📈 Trailing Stop Strategy: Move SL to entry ($41.80) after TP1 ($50.32) is hit.
💰 Partial Profit Booking Strategy:
✔ Take 50% profits at $50.32, let the rest run to $60.38.
✔ Adjust Stop-Loss to Break-even ($41.80) after TP1 is reached.
⚠️ Fake Breakout Risk
❌ If price fails to hold above $41.80 and drops back, exit early to avoid losses.
❌ Wait for a strong bullish candle close above $41.80 for confirmation before entering aggressively.
🚀 Final Thoughts
✔ Bullish Setup – Breaking above $41.80 could lead to higher targets.
✔ Momentum Shift Possible – Watch for volume confirmation.
✔ Favorable Risk-Reward Ratio – 1:1.47 to TP1, 1:3.22 to TP2.
💡 Stick to the plan, manage risk, and trade smart! 🚀🏆
🔗 #StockTrading #HIMS #BreakoutTrade #TechnicalAnalysis #MomentumStocks #ProfittoPath #TradingView #StockMarket #SwingTrading #RiskManagement #ChartAnalysis 📈🔥

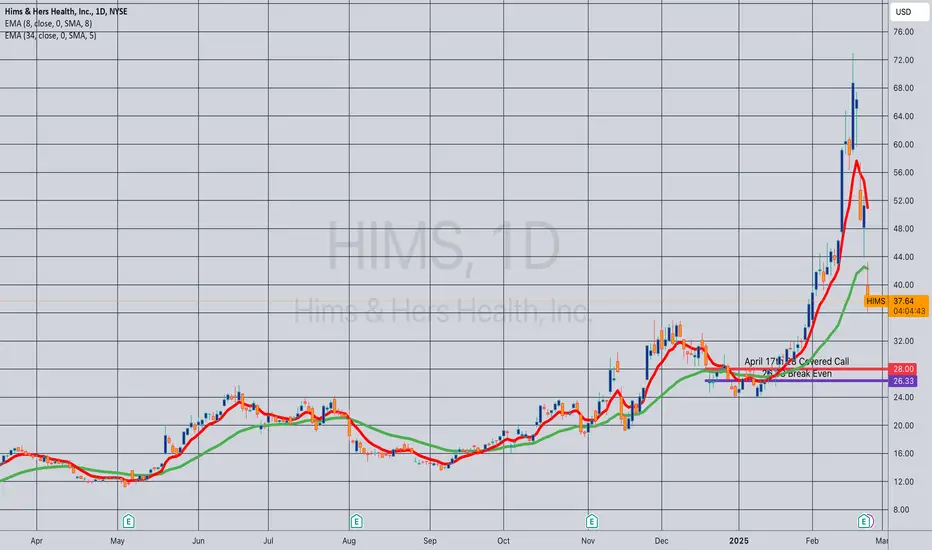
Opening (IRA): HIMS April 17th 28 Covered Call... for a 26.33 debit.
Comments: Throwing a few bones at this high IVR/IV (57.5/109.4) single name post-earnings, selling the ~84 delta, 2 x expected move call against shares to emulate the delta metrics of a 16 delta short put, but with the built-in defense of the short call.
Metrics:
Buying Power Effect/Break Even: 26.33/share
Max Profit: 1.67
ROC at Max: 6.34%
50% Max: .84
ROC at 50% Max: 3.17%
Will generally look to take profit at 50% max/roll out short call if my take profit is not hit.