HOOD trade ideas
Bull Trap Confirmed: HOOD's Rally Faces Exhaustion Part 2Hey Traders after the success of our last month trade on Tesla hitting all targets more than 35%+
With a Similar Trade setup I bring you today the
NASDAQ:HOOD
Hey Guys sorry but i just had to Reinitiate this trade with some updates
Short opportunity on Hood
Based on Technical + Fundamental View
-Market structure
-Head and shoulder pattern
-Caught in a Bull TRAP
Pro Tip
If today's day Pinbar's low broken tomorrow we can place a trade. (Morning Trade)
Target 1 - 35.52$
Target 2 - 30.81$
Target 3 - 26.26$
Stop Loss - Above Entry Candle
For Rest of the Details follow Part 1!
NOT AN INVESTMENT ADVISE
HOOD to S&P by 2026!?!-From Meme to MajorsWhile skeptics may still associate NASDAQ:HOOD with meme-stock mania, I'm betting on the company's evolution:
Consistent revenue growth with expanding crypto + options volume
Clear move toward profitability and institutional trust
Increasing daily active users + net deposits = sticky growth
Expansion into IRAs, advisory services, and full-stack finance
Regulatory overhangs are fading — and brand loyalty among Gen Z is rising
Technically, NASDAQ:HOOD has bottomed and is building long-term support above key levels.
Fundamentally, it’s positioning to replace a legacy fintech in the S&P within 12–18 months.
This is the kind of contrarian bet that makes a career.
Watch for quarterly surprises, buybacks, and improved margins.
Target timeframe: April 2026
Thesis checkpoint: $20+ breakout in 2025
Drop your thoughts — bullish or bearish — and follow for updates.
why Robinhood’s stock ($HOOD) could be considered bullish:Analyst Upgrades : Robinhood has received positive upgrades from analysts, with a target price suggesting a significant upside. The company's growth in digital wealth management, AI-powered investing, and new banking features contributes to these bullish forecasts.
Strategic Investments : High-profile investors, such as Cathie Wood’s ARK Invest, have increased their stake in Robinhood, signaling strong confidence in its future growth potential.
Product Diversification: The company continues to expand its services, with new offerings like Robinhood Strategies, an affordable robo-advisor, which is expected to attract a broader customer base seeking wealth management solutions.
Positive Analyst Sentiment: Robinhood has an average "Buy" recommendation from analysts, reflecting general market optimism and the stock's positive outlook over the next 12 months.
Strong Earnings Growth: Robinhood's robust revenue growth rate (over 58% in the last 12 months) reflects its expanding market share and the potential for continued financial success.
Analyst Price Targets: Multiple analysts have set a price target for Robinhood with significant upside potential, indicating that there is room for further price appreciation in the coming year.
Market Positioning: Following political shifts, Robinhood's stock has benefited from increased interest in cryptocurrency trading and favorable market conditions, showing how external factors can favor its performance.
Technological Advancements: Robinhood’s investment in AI tools like Robinhood Cortex enhances its platform’s value proposition, improving user experience and engagement, which could lead to increased retention and growth.
Diversified Revenue Streams: Robinhood’s move into banking, offering high-yield savings accounts, allows the company to tap into new revenue streams, reducing its reliance on traditional brokerage commissions.
Favorable Market Sentiment: Robinhood is seen as part of a broader trend of stocks benefiting from shifts in market sentiment, particularly around the "Trump trade," showing how political and economic cycles can impact stock performance positively.
These factors together suggest a promising outlook for Robinhood’s stock, positioning it for continued growth and potential upside.
Robinhood: Turn Off the SELL Button?I don't have to remind you what Vlad and the boys did back in 2021
Crime has always been a part of Markets..I get that
Crime will ALWAYS be a part of markets as long as GREED is rewarded
But thats where Regulators are supposed to help hold the crooks accountable..right?
As we all know that has NEVER happened
Why? Because the size of fines are never large enough to truly deter..they are simply a cost of doing business
But hey...according to the crooks we see paraded across our TV screens we need LESS REGULATION anyways because you know..FREE MARKETS!..and all that stuff right
Ok cool, well then lets do the whole Free Market thing..you know the whole, "We need LESS REGULATION because Free markets will take care of Bad Businesses" thing
Well then thats fine by me...
MAJOR PUT POSITION COMING SOON..Vlad
And GME is going to provide me with the ammo..now isnt that poetic :)
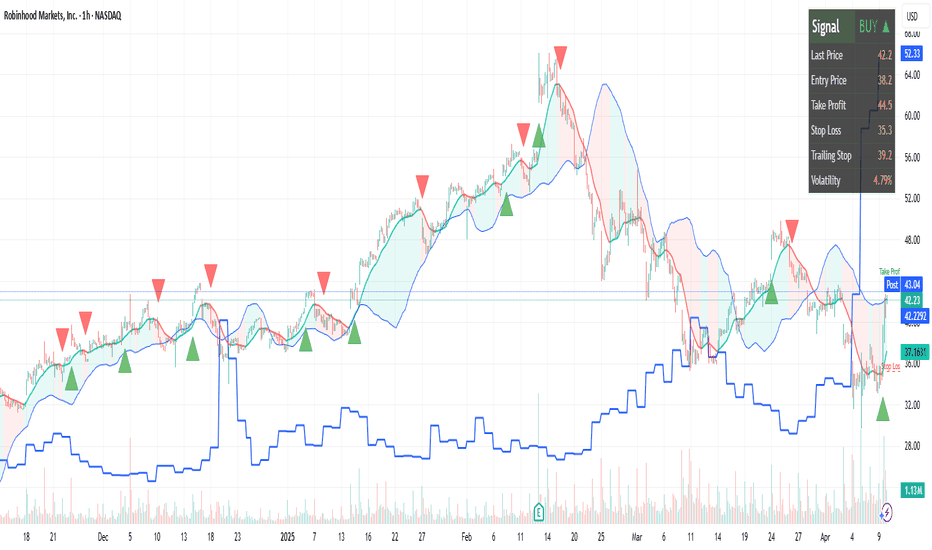
Robinhood (HOOD) – Daily Chart AnalysisAs of March 25, 2025, Robinhood (NASDAQ: HOOD) is approaching a high-volume resistance level near $48.15–$48.48. Price has been rallying off a March low and is now testing key areas of confluence that could either trigger a breakout continuation or prompt a corrective move.
Technical Overview
Price Structure
Current Resistance Zone: $48.15–$48.48, aligning with the Volume Profile High.
Support Structure: Ascending trendline stretching from August 2024 lows; recent price behavior has respected this line cleanly.
Fibonacci Levels
0.5 retracement at $56.49
0.618 extension above $60
These are potential upside targets if current resistance is cleared on volume.
Momentum and Trend Indicators
RSI
The RSI indicator has turned upward and exited its prior downtrend channel.
The last three times this indicator rebounded from its lower band (circled on chart), price followed with a sustained bullish leg.
Currently printing near 54.68, suggesting renewed momentum without being overbought.
Trend
Recently flipped bullish: the green histogram has turned positive, and the wave has crossed above its signal line.
Previous flips from similar structure (highlighted by white dots and wave crossovers) have marked strong trend beginnings.
The clean separation between the wave and signal line is a confirmation of strength.
Volume
The most important tell: the recent reversal mirrors August and September 2024 setups nearly identically.
The March 10, 2025, bottom was accompanied by a smooth upward curve and bullish divergence.
The projected yellow path (shown on the chart) suggests volume support is building under price, signaling sustainable upside.
Scenario-Based Outlook
Scenario 1: Bullish Breakout
Price breaks above $48.48 with volume.
Indicators confirm momentum across all three custom tools.
Target: $56.49 (0.5 Fib), then $60.00–$62.00 (0.618 Fib + psychological level).
Scenario 2: Rejection & Pullback
Price stalls at Volume Profile High.
Pullback into trendline or full retracement toward Buy Zone ($37–$36).
Watch for renewed confluence from RSI+, WaveTrend 3D, and Volume Buoyancy for long re-entry.
Summary
Robinhood is at a critical juncture. Momentum across the RSI+, WaveTrend 3D, and Volume Buoyancy is aligned to support continuation—but the price must clear the Volume Profile High to confirm. If rejected, the trendline and deeper demand zone provide defined levels to reassess. Indicators suggest the recent bottom was a structural low with strength building beneath the surface.
This setup offers a favorable risk-reward profile in both breakout and pullback scenarios, provided the indicators continue to support momentum and volume follows through.
Bull Trap Confirmed: HOOD's 8% Rally Faces ExhaustionHey Traders after the success of our last month trade on Tesla hitting all targets more than 35%+
With a Similar Trade setup I bring you today the NASDAQ:HOOD
Short opportunity on Hood
Based on Technical + Fundamental View
-Market structure
-Head and shoulder pattern
-Currently will be trading at supply zone which was a recent support and now an ideal place for a reversal to create the right shoulder of the bigger head and shoulder pattern - Daily time frame.
1. Declining User Growth and Transaction-Based Revenue
2. Regulatory and Legal Challenges
3. Rising Costs and Profitability Pressures
4. Intense Industry Competition
5. Macroeconomic and Market Volatility
Technical View
Head and shoulder pattern - Pretty visible. Right shoulder is yet to be formed, Which makes an ideal place to SELL with a great Risk Reward ratio.
Pro Tip
Wait for a bearish candle stick pattern to execute trades on end of the day keeping stop loss somewhere above the supply zone.
Target 1 - 35.52$
Target 2 - 30.81$
Target 3 - 26.26$
Stop Loss - 44.72$
Fundamental View
1. Declining User Growth and Transaction-Based Revenue
Robinhood’s revenue model relies heavily on Payment for Order Flow (PFOF), which makes it vulnerable to fluctuations in trading activity. After a pandemic-driven surge in 2020–2021, user growth stalled, with monthly active users dropping 34% YoY to 14 million by mid-2022. Transaction revenue fell 55% in Q2 2022, and while assets under custody grew to $140 billion by Q2 2024, the platform’s dependence on volatile crypto and meme-stock trading amplified revenue instability.
2. Regulatory and Legal Challenges
The SEC’s scrutiny of PFOF and proposed trading rule changes threaten Robinhood’s core revenue source. In 2022, New York regulators fined Robinhood’s crypto unit $30 million for anti-money laundering violations. Ongoing legal risks, including backlash from the 2021 GameStop trading restrictions, have further eroded institutional trust.
3. Rising Costs and Profitability Pressures
Operating expenses surged due to aggressive marketing, technology upgrades, and compliance investments. Despite workforce reductions (23% layoffs in 2022), profitability remains strained. The company’s shift toward diversified products like retirement accounts and credit cards has yet to offset these costs.
4. Intense Industry Competition
Traditional brokers like Fidelity and Charles Schwab adopted zero-commission trading, neutralizing Robinhood’s initial edge. Newer platforms like Webull and Public.com also captured younger investors with advanced features, while Robinhood’s limited product range (e.g., lack of wealth management services) hindered retention of high-net-worth clients.
5. Macroeconomic and Market Volatility
- Interest Rate Sensitivity: As a growth stock, HOOD declined amid rising rates in 2022–2023 and broader tech-sector sell-offs.
- Recent Market Turmoil: On March 10, 2025, HOOD dropped 18% alongside crypto-linked stocks like Coinbase due to Bitcoin’s price volatility and fears of inflationary tariffs under new U.S. policies.
- Retail Investor Pullback: Reduced discretionary investing and crypto crashes (e.g., Bitcoin’s 71% plunge in 2022) dampened trading activity.
NOT AN INVESTMENT ADVISE
HOOD - Get Great PricingNASDAQ:HOOD and I have had a mixed relationship over the years. I have had my biggest win on the HOOD brokerage (5,000% options trade, $1200 into 60k) and at the same time I was present for the Derogatory removal of the GME button (of which I had sold before they took that button).
After many years and brokerages, I find myself returning to HOOD but this time much more experience... To my surprise, I love the platform, and I still recommend it for new traders for the ease and UI. Honestly, unless you are dealing with BIG Volume or Hot-Keying out of Low float Penny stocks, It will suit you just fine.
Now Let's Talk HOOD.
In this MASSIVE range we are looking at High $67, and a Low of $35. Thats a 47% drop!
Although we have recovered a bit, Many are eager to find a way to get in the range. Here I have put together 2 scenarios to help you play your position with confidence.
Better Price = Better psychology
Whether we are shopping at grocery store, or if we are buying a car. Getting a good deal feels better. But how do you feel when you know you overpaid?
TLDR: The best deals are the lowest purple zone "Extreme Demand" if you are Long, "Reinforced Supply" (at the top) if you are looking to get short or take profit.
Under the HOOD
Currently Robinghood is running into a little bit of a supply zone labelled "Weak Supply"
This is a new player, and we don't yet know how just how big this player is. So far they have absorbed some of that buying pressure coming in, but I would not be surprised if they we overtaken or even gapped above come Monday. This brings us to our first Scenario
Scenario 1: Blue line
With the break above "weak supply", there is headroom all the way until 51.74. This is where we will see some supply initially and maybe a small rejection.
Why would it not reject back down to a demand area like 41? Great question.
If this overtakes that "Weak Supply" zone, this will make a strong case that there is momentum behind the wheels here. I think there will be a new player reinforcing this buying if this happens all the way to the Finale at $58.01. From here I would consider taking some profits, maybe partials, or looking for some Puts.
Scenario 2: Red line
Getting Rejected by "Weak supply" would be evidence that this move was fluff. Those two demand zones may try to hold a bit, but with the lack of buying interest in the
$45 area, this won't make those buyers feel confident.
This is different story when comparing to the "Extreme Demand" zone (lowest purple zone). Buyers here have PROVEN that this is something they are very interested and they are not done accumulating yet. So from this location buyers feel confident that they are getting a good price*( see fn. )
From here this should drive demand up again, crushing shorts, and sending another nice squeeze to test that supply at 51.71
WHEW! if you made it this far, I appreciate your time!
Upvote/Follow if you enjoyed this idea, there are many more to come!
Happy trading!
* (This is a good price, because buyers are showing that it is. Although, if it did come down here, this would be the 4th test of this area. I still think there will be strong demand here, but this isn't the best tests. 2nd and 3rd were stronger.)
cup and handle pattern may be forming on the weekly chart HOOD"Potential Cup and Handle Pattern on NASDAQ:HOOD
A cup and handle pattern may be forming on the weekly chart of HOOD. The cup formation can be seen from August 2024 to February 2025, with a high point of around $55.00 and a low point of around $14.00. The handle formation started in late February 2025 and is currently ongoing.
Key levels to watch:
Resistance: $50.00
Support: $39.00
A breakout above the resistance level could confirm the pattern, potentially leading to a bullish trend. Keep a close eye on this stock! Weekly Daily and Monthly all look good.
#HOOD #cupandhandle #stockmarket #trading"
$HOOD - What could happen next?NASDAQ:HOOD did get a bounce from that support area. There is certainly a danger of a head and shoulder formation but I am not too worried about it.
Watch for that channel breakout. Confirmation is closing above $43 for 2 trading session.
See target and support areas in the chart.
Robinhood’s Moment of Truth! Breakout, Retest, and Go? Hi,
Robinhood is one of the potential candidates to be included in the S&P 500 index. The new grouping will take place in 21. March
From a technical perspective, this is one of the possible zones where, after a short pause, we saw a breakout and now the price has come back to retest the consolidation area.
Of course, fundamentals play a big role here, but historically, a similar setup has worked well last year.
So, the zone is set—let’s see if this move repeats itself. Technically, the key range is $35 - $44.
Cheers,
Vaido
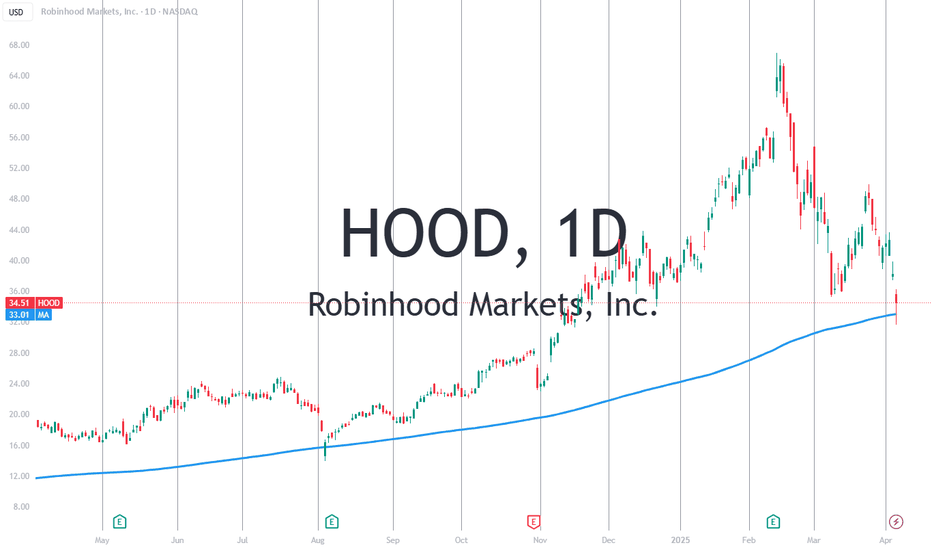
Short term bearish Daily - 03/10/25
Broke and closed under 50MA; seems bearish.
Trend: From 13.98 to 66.91. (Overnight trading price touched $40.00.)
Gaps: There are gaps that may need to be filled between 25.31 - 34.20.
Potential Buy Area: If the price tests and rejects 34.20, it could present a buying opportunity.
Indicators: Use RSI and MACD to confirm that buyers are in control. If the price breaks & Rejects 34.20, we’ll most likely see it drop to 25.31 and close those gaps before we make our way back up for earnings.
Disclaimer: This is not investment advice; invest at your own risk.
I'm buying all the robinhood i can right nowI love this area for hood, obvious retest. Hood now about a 60% correction from the highs, a very typical sell-off after such a strong move. Also at higher levels of ichimoku cloud support. Lots of confluence and the business is executing at the highest level, taking business from the legacy brokerages.
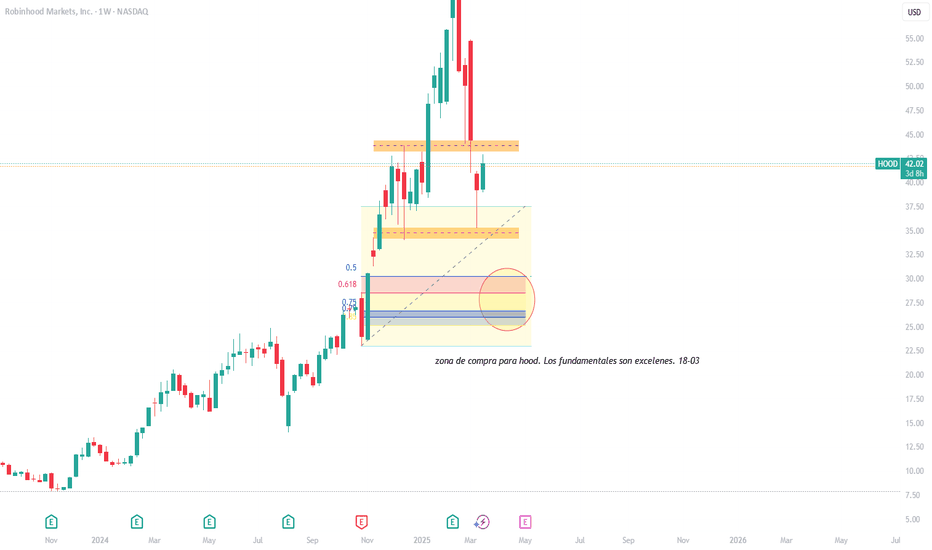
Hood in buy zoneHood finds itself in the weekly demand zone. The stock is also potentially in the golden fib pocket as well. We saw a very nice reset in stochastic momentum here. I have started to add to this position again. I have been out of the position for a while and look to stay with my aggressive small/mid caps this year.
My plan:
Adding shares here, possibly selling CSP. I would wait on covered calls for a bit if possible.
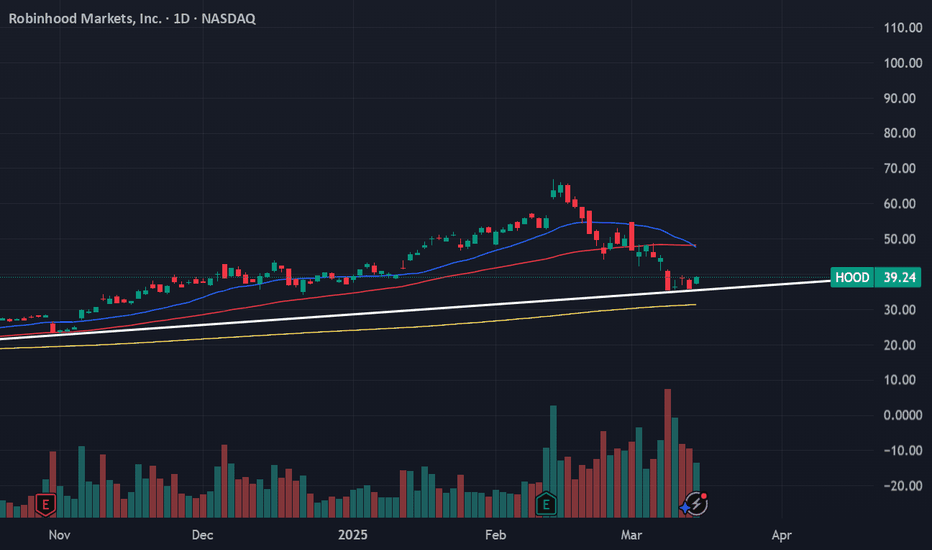
$HOOD has Bottomed Out Using My Favorite Technical PatternWhy is it that broken lines of resistance being used as new support (works vice-versa as well)? Because it works virtually every time! 😏🏆💯
We had sizable 3/21 NASDAQ:HOOD puts in the WAVE$ Portfolio for the past week, and early this morning we locked-in a 4X profit. 🙏🏼🔒💸
We then used those put-profits to shark up some more NYSE:UBER and NASDAQ:RIOT call options, and establish a NEW call options position on $HOOD. 📈📈📈🦈
I think that NASDAQ:HOOD has bottomed out following that re-test of broken resistance (yellow trend line), and although it may take a bit to see new highs, I think that we'll be seeing mostly upside from here. ⚓️✔️
-Royce 🤙🏼
Maybe one more retest? I been buying this hood dip, but it's possible the low 40s need to be tested before the next leg up (which i think takes it to $80-$100). It's possible the correction could already be over, but i'd wait for a breakout of the $55 level to be confident in saying that. I've got cash set aside and will be buying the low 40s aggressively if it comes.


