IBM trade ideas
IBM major levels to watch (end of April 2017)IBM has made an important low in the beginning of this year 2016. And since then it has been rising, with minor pullbacks.
Since I am recording validations of short scenarios in monthly and weekly timeframe my investigation started on this stock.
Analysing the major tops and bottoms of IBM
Low: nov 2008
Top: mar 2013
Low: jan 2016
Uptime: 1080 bars
Downtime: 717 bars
Total cycle: 1797 bars which is 4.99 times the 360degrees of a circle
Ratio down:up: 0.666 with offset of 2.28 days which is one degree on the Gann Wheel.
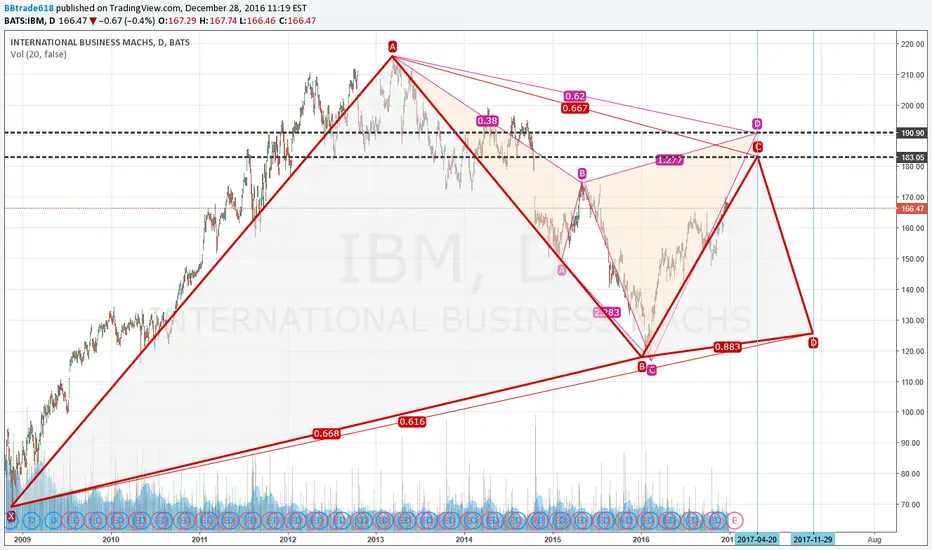
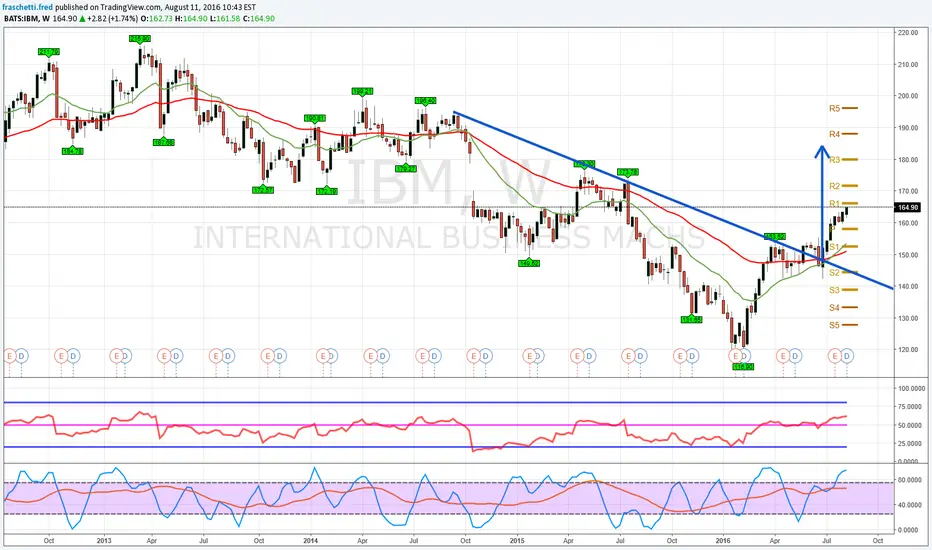
As seen in the harmonic pattern, price retraced 0,666 and made the Jan 2016 low (point B in red). Drawing an harmonic relation only from the down wave, gives an allignment in point D around 189euro would be ideal scenario to short.
However the major cycle triggers shorts at an early level of 183euro (point C in red) and sets the date at 20th of April 2017.
It is possible to estimate the cyclical time more linear with an average cyclical time near 20 weeks is also providing and underlyning Gann estimates in time.
I have sets alerts on my candle patterns detection and volume pattern screener, if time and price allign.......a trade is possible towards 29th of November 2017 (which is 9 years and 10.5days after the nov 2008 low.) If 10.5days i divided by a year 365 days, you get the disponantions effect of a square in a wheel of 2.28. And yes this is also very close to fibonacci extension 2.276.
Although those projection in time&price have some offset, and can only be traded well with money&risk management rules in place, it displays the cause of market movement. And not the effect, which is an outcome with hindsight!

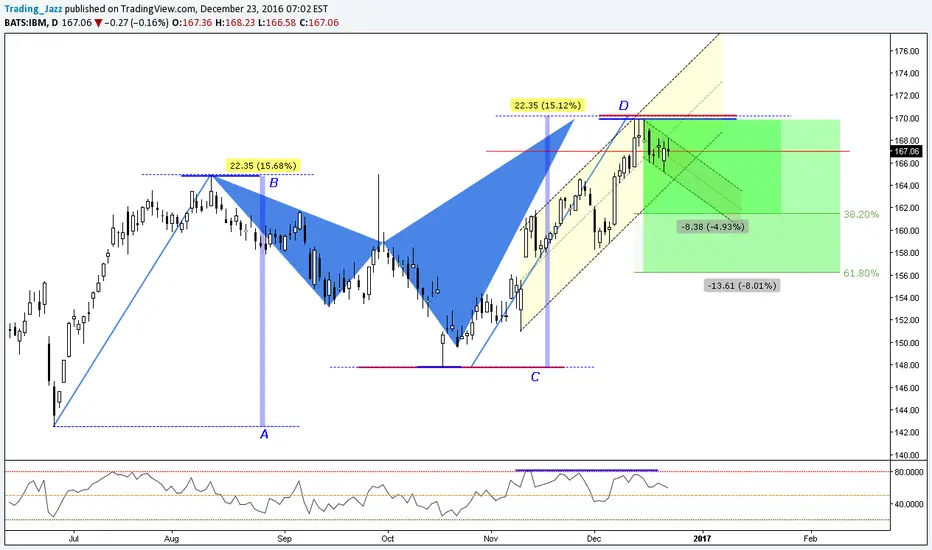
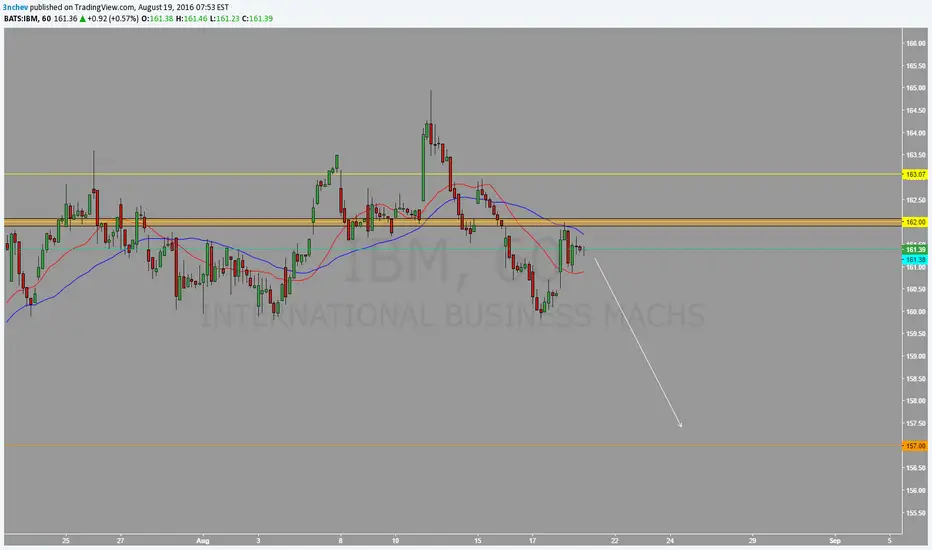
buyuptrend...
after breakout im looking for pullback ending...
buy after bullish candle or nice trigger

$IBM Slam Down Coming, Check Out This Chart...Shares of International Business Machines Corp. (NYSE:IBM) are on the verge of a sharp fall based on the stock hammering into not one, but two trend line resistance points. This can clearly be seen on the stock chart below and is a warning to investors to sell their long positions and maybe even short the stock into year end. January might be ugly for IBM. The pull back level is likely $155.00 from its current $166.99 in January 2017 alone.

SHORT IBM : AT 168.60$ for Target 158-159$ Sl 170.60$ It's Worth to Short IBM at Current Price of 168.60$ For A very little SL. of 2 $
Reason : According to W.D. Gann's Methods Price and Time is Squaring at 169 to 170 Levels.
Above 170 it's not, According rules, Squaring Hance Stop loss is very small.
If today IBM remains below 169 then There can be Short Term Reversal for IBM.
So it's Worth to take Risk of 2 $ for a Price Target of almost 10 $ :)
IBM must Remain Below 169 Today


$IBM long Seems like it found support already, one can zoom in and dig for long setups. minimum target would be 212.xx.
I've also noted the larger support levels for long term bids potential target for longer term is 341+.


Option for Stock replacement in IBM
I currently own 300 shares of IBM and bought in averaging 121 per share. IBM current price: 151.35. I am mixed between taking a profit or holding out for more gains. What to do? Well, buying call options in IBM will allow me to stay long while at the same time take my profit on the stock gains. This all sounds good and easy but not all market environments war-rant, in my mind, simply buying calls to replace a long-stock position. But there is currently a trend I see occurring in IBM that is begging my trading-intuition to pull the trigger on. Let’s take a look at the earnings history for IBM utilizing the MarketChamelion data.
Going back the last few years, one can see that IBM has consistently sold-off following earnings announcements. marketchameleon.com
Folks, I’m not sure about you all but I get the feeling that the market and the analysts have started to realize that whatever announcement IBM makes on earnings day, well, the stock sure is not going up. And we all know that trading is not an exact science. I see it as a blend of logic based on the data provided to us and our own market intuition. In the IBM scenario, I see these consistent down days in IBM following earnings as a sign that traders and analysts are starting to lower their bullish expectations on IBM following earnings, and this is being priced into the current stock price. Based on the data, my gut tells me that the downside in IBM is limited and therefore I am comfortable holding this stock for further gains and that the probability of a larger upside move is greater than the market has priced in.
With IBM expected to release earnings on 01/17/17, I take a look at the Marketchamelion data for IBM options expiring January 17, 2017 marketchameleon.com
I can buy the IBM 155 calls for 3.50. Sure, if IBM were guaranteed to go straight up I’d make more money owning the stock verse buying the calls, but like I mentioned, I bought in at 120, and under the current signs I am seeing in the market for IBM, the upside is alive and well and the market will reward any bit of good news on earnings day. I’ll take my risk off the table and sell my long stock and then buy the calls, still retaining possible upside post earnings gains I am expecting. I can always buy an extra call or two, bringing my potential holdings on the stock to 500 shares via options holding verse 300 shares verse my past stock holding. My profits in the stock allow me to take this added risk. And if we get a big move upwards I’ll potentially make more money than I would have had I held on to the 300 shares, verse the 500 long shares I’ll have via the options.

IBM: Earnings out tomorrowLet's monitor IBM here, after earnings we might a drop down to support, where it can be an attractive long. We have to wait one day more after earnings are out, to trade it, but we can already label the key levels on chart, and determine what our bias is going into the report, and what fundamentals tell us.
I like IBM here, specially if it drops lower, with 8.5% earnings yield and a 6.6% free cash flow yield, growth opportunities are around the corner for IBM. Revenues have been down, but technicals favor uptrend continuation in the monthly chart, specially if we manage to break above the downtrend mode to the left soon.
Good luck,
Ivan Labrie.

THE WEEK OF 10/16: WHAT I'M LOOKING ATWhile I grind away on various covered call positions (I only have one covered call with an October short call on; the rest are in November or December), I'm looking ahead to some decent earnings for premium selling.
Generally, I'm looking for underlyings whose implied volatility is above the 70th percentile for the past 52 weeks and that have background implied volatility of greater than 50% to play for a contraction in volatility immediately following the earnings announcement, with the go-to strategies being short strangles or iron condors.
Currently, there are four underlyings with good liquidity options that announce earnings next week and whose volatility is above the 60th percentile for the preceding 52 weeks: IBM, NFLX, UA, and EBAY. I'm screening for >60 implied volatility rank at this point, since volatility in these could still ramp up to my >70%, meaning that they might be worth keeping an eye on.
IBM -- Announces 10/17 after market close. The implied volatility rank is now in the 85th percentile. Unfortunately, the background implied volatility is far from being up to snuff at this point for me (28.3%).
NFLX -- Announces 10/17 after market close. Implied vol rank: 64th percentile; implied volatility 56.6%. It's very nearly "there". Hopefully implied volatility pops a little more right before earnings.
UA -- Announces 10/17 after market close. Rank: 62; implied vol 41.7%. Needs more.
EBAY -- Announces 10/19 after market close. Rank: 93; implied vol 41.6%. Needs more.
After I look at implied volatility percentile and the background implied volatility, I look at what I can get out of a setup. Generally, I'm shooting for a 1.00 credit for either a short strangle or iron condor, since I look to take these off at 50% max profit (i.e., a .50 ($50)/contract profit). Alternatively, I look at whether a short straddle or iron fly would make sense if the underlying is just too cheap to yield a decent enough credit. With short straddles/iron flies, I generally look to get 2.00 in credit at the outset, since I tend to manage those at 25% max.

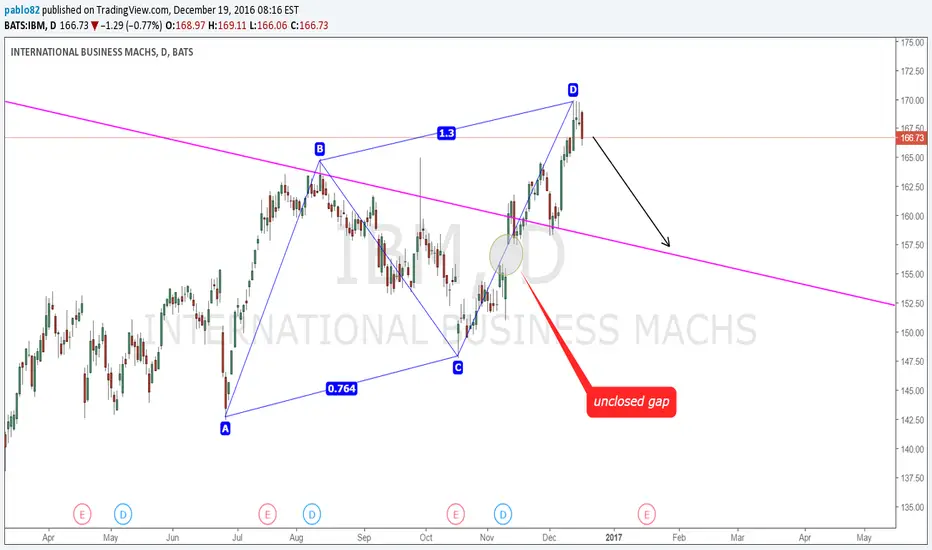
IBM Long Term Sell Setupif the market break the trend line we might have good long sell chance good luck

Time To Buy IBM? Price had been moving down the lower BB. We now have divergence, a double bottom / W pattern has formed, a tag of lower BB with several bullish candle reversals, and price has broken the resistance level of the W. Stochastic up with signal cross. A true candle purist will wait until price breaks the falling window pattern as that is near term resistance.
Can buy now intraday, or wait til candle closes on daily chart above nearest point of resistance.


IBM LONG OPPORTUNITY 1. Bullish divergence on the MACD.
2. Price bouncing on the 0.618 retracement
3. Momentum suggests a breakout may happen if it does, buying on the breakout would be a good idea.
