Looking to buy infosys when the range of 1650 gets broken...looking to buy infosys when the price of 1650 get broken decisively..
it can give good returns,final target oF 1960-1970..
it's a complete swing trade
Next report date
—
Report period
—
EPS estimate
—
Revenue estimate
—
0.675 CHF
2.80 B CHF
17.07 B CHF
4.15 B
About INFOSYS LTD
Sector
Industry
CEO
Salil S. Parekh
Website
Headquarters
Bangalore
Founded
1981
FIGI
BBG00TDM6GM7
Infosys Ltd. is a digital services and consulting company, which engages in the provision of end-to-end business solutions. It operates through the following segments: Financial Services, Retail, Communication; Energy, Utilities, Resources, and Services; Manufacturing, Hi-Tech, Life Sciences, and All Other. The company was founded by Dinesh Krishnan Swamy, Senapathy Gopalakrishnan, Narayana Ramarao Nagavara Murthy, Raghavan N. S., Ashok Arora, Nandan M. Nilekani, and S. D. Shibulal on July 2, 1981 and is headquartered in Bangalore, India.
Related stocks


InfyWhenever marked structure is broken on upper side infy can give good risk to reward trade. However no one knows how much further consolidation can happen.It has slowly started making positive price action above lower time frame 200 ema.
This is just for education and no buying or selling recommendat
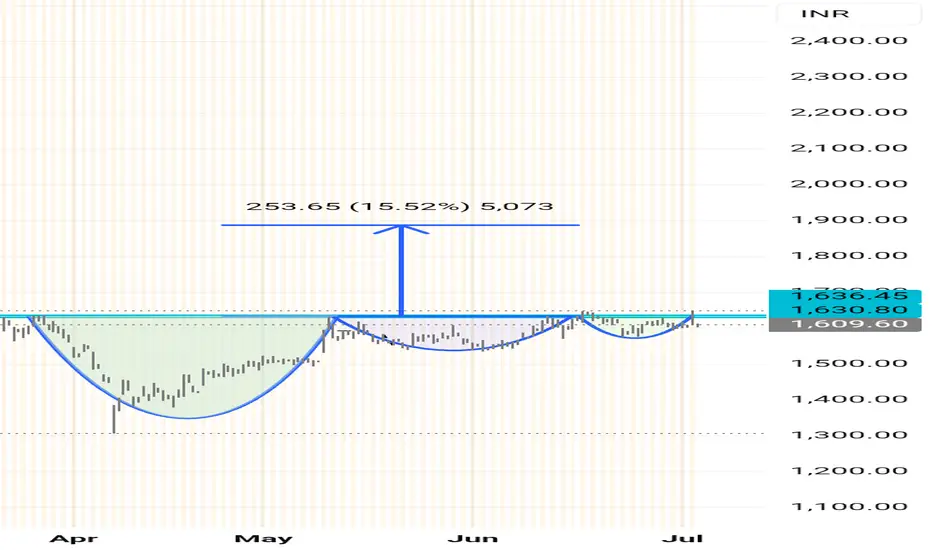
Infosys with Cup and Handle chart pattern Infosys on daily get Buy signal from our Private Indicator and also forming a low pivot cup and handle chart pattern.
Buy and set stop loss according to ADR% shown on chart.

INFOSYS 📊 Chart Analysis – Infosys Ltd (INFY)
Currently, the stock is testing a key resistance zone between ₹1620–₹1630.
If the price breaks and closes above this resistance, it can signal a strong bullish breakout.
---
💼 Trade Setup (Based on Cup and Handle Pattern):
Entry (Buy): On a closing above ₹

INFY_Neutral to Long- Price near one of the Resistances.
- Price has not broke out; However it showed good strength with big green candle
- Wait till how the next 2 days are going to be .

INFY | Buy @LTP | SL below 1525 | Targets 1880, 2000Disclaimer:
This is not financial advice. Please do your own research or consult with a financial advisor before making any investment decisions. Investments in stocks can be risky and may result in loss of capital.

Infy Bullish Infy 1563 is showing signs of bullish for target 1620. Support 1549.
Currently Undervalued and has potential to target 1833.

INFY 1H Chart Analysis (Bullish Bat + Falling Wedge)NSE:INFY
INFY 1H Chart Analysis (Bullish Bat + Falling Wedge)
In this 1-hour chart of Infosys Ltd (NSE: INFY), a Bullish Bat Harmonic Pattern has completed at point D, suggesting a potential reversal zone. Additionally, a falling wedge formation adds to the bullish confluence.
1. Pattern Struct

Infy India is in making of big move ... Disclaimer : This is just a chart analysis based on my understanding. Do your own research before investing.
Looking at daily chart of Infosys, first a chart pattern of M was made in the past which means stock moved up and come down. Now its trying to form a inverted head and shoulder chart patter

See all ideas
Summarizing what the indicators are suggesting.
Neutral
SellBuy
Strong sellStrong buy
Strong sellSellNeutralBuyStrong buy
Neutral
SellBuy
Strong sellStrong buy
Strong sellSellNeutralBuyStrong buy
Neutral
SellBuy
Strong sellStrong buy
Strong sellSellNeutralBuyStrong buy
An aggregate view of professional's ratings.
Neutral
SellBuy
Strong sellStrong buy
Strong sellSellNeutralBuyStrong buy
Neutral
SellBuy
Strong sellStrong buy
Strong sellSellNeutralBuyStrong buy
Neutral
SellBuy
Strong sellStrong buy
Strong sellSellNeutralBuyStrong buy
Displays a symbol's price movements over previous years to identify recurring trends.
Curated watchlists where IOY is featured.

Indian stocks: Racing ahead
46 No. of Symbols
See all sparks