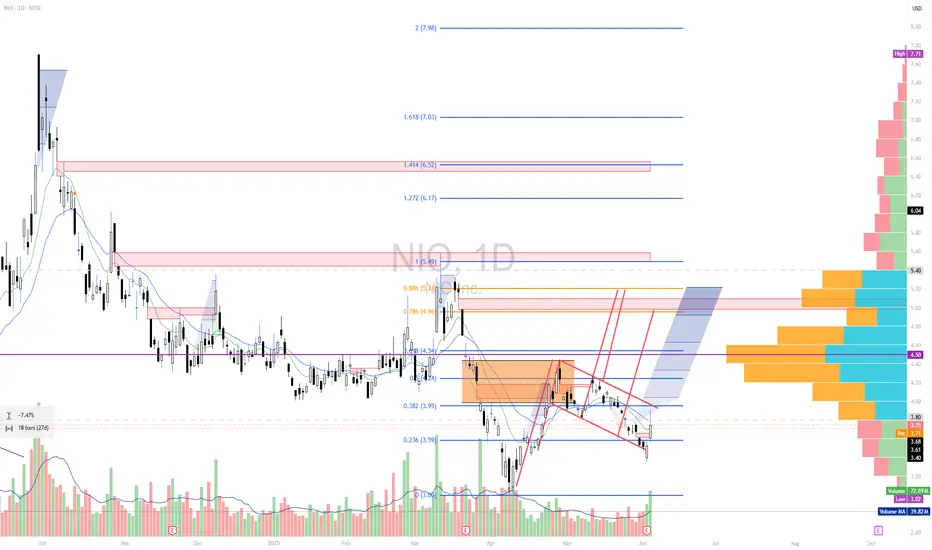
NIO CHART UPDATETRENDS AND PRICE TARGETS MARKED
GAPS IN YELLOW
Guideline in yellow.
Watch the two major trends closely, (RED)
short term trends going down are about to break.
Red trends will become support when price crosses over and confirms the Daily.
Good luck!
N3IA trade ideas

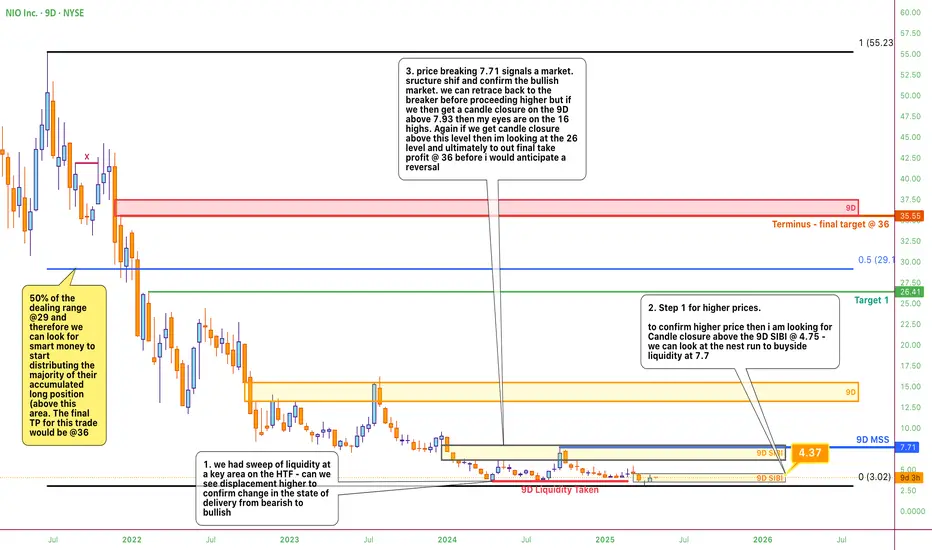
NIO - The Bullish RoadThere is a long road to go to see any bullishness in NIO. This diagram is a simple annotation of the steps for higher prices and bullishness on NIO. Right now we might be seeing the beginning of a shift to bullishness if we star displacing higher and price signatures such as bullish fair value gaps left open would help strengthen the bullish bias.

NIO - The side road to higher pricesIs NIO going higher and if so when? Technical analysis and fundamental analysis and any type of analysis may be proving more confusing the longer you have followed this company and so I hope this chart provides you with a clear view of atleast what is required in the short term to start the trek higher - until we see these signatures in price as of now the orderflow is still bearish (and no this does not mean to short in what is a heavily undervalued stock IMO) at prices institutional investors are picking up their long position.
If this chart provides you any value or you have a different view then please leave a comment

NIO NIO NIO i want to see blue skiesFor long term investors who want to get beyond the riffraff of technical prices analysis and scribbled charts- look no further - a simple and clear read on NIOs road to higher prices. If we get a candle closure on the 3M candle above 7, then we can look for the 24.5 target.
Keep safe and for us NIO lovers - hopefully there are bluer skies ahead- imminently on the pending financials.

NIO - Clear Skies AheadFor those looking to invest in Nio or already invested and praying on a better sky - the bullish way is predicated on price following the road i have outlined on the chart. We are at an area of price where we can start to see institutional players step in now after accumulating very cheap positions in what is in my opinion one of the outstanding EV companies in the world.

LONG NIOflags everywhere, and its weird. it feels odd to repeat the same process but thats all the market does and it works...
t1 $4.20
t2 $5.00
opened $5 strikes in sept., glhf
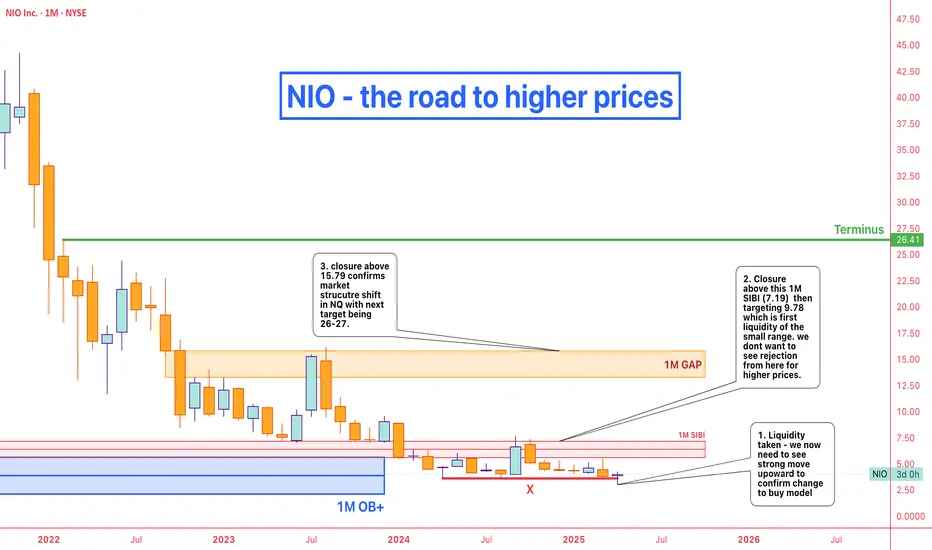
NIO - Beyond the confusion, the road to success is clear this simple charts aims to simplify what to look for in higher NIO prices.
Is Nio’s ambition outpacing reality?Chinese electric vehicle maker Nio faces significant challenges despite strategic efforts like the recent launch of the Firefly brand. A successful and innovative company known for its battery swaps, Nio is now grappling with increasing domestic competition, slowing economic growth, and significant financial losses reflected in its low share price and market cap. The company’s path forward, and particularly its ambitious global expansion, increasingly appears fraught with external pressures and technological hurdles that threaten its long-term viability.
Chief among these challenges is rising geopolitical risks. Rising trade tensions between major global powers, including potential tariffs from the US and Europe, directly threaten Nio’s access to the international market and its growth prospects. More critically, the unresolved situation regarding Taiwan poses a serious risk of conflict (a Chinese invasion of Taiwan) and subsequent international embargoes. Such a scenario could disrupt global supply chains, especially for critical components such as semiconductors essential for electric vehicles, and cripple Nio’s production and sales.
Furthermore, Nio is in an expensive technological arms race, particularly in autonomous driving, competing with global leaders such as Tesla. While Nio uses a multi-sensor approach with LiDAR in its Navigate on Pilot Plus (NOP+) system, Tesla’s vision-only strategy and extensive data collection pose a formidable challenge. Both companies face obstacles, and with the complex task of perfecting autonomous technology in diverse environments, Nio must not only adapt to technological advances but also navigate complex regulatory landscapes and execute flawlessly to compete effectively and justify its significant investments in this space.
An Important Bullish Pattern Forms on the NIO Share Price ChartAn Important Bullish Pattern Forms on the NIO Share Price Chart
Today, the share price of NIO Inc. (NIO), a Chinese manufacturer of "smart" electric vehicles, is trading above $4 – a development that may be viewed as an optimistic scenario following the drop to $3 in the first half of April, marking the lowest level in nearly five years.
Why Has NIO’s Share Price Risen?
Bullish sentiment has been supported by news that the company: → increased vehicle deliveries by 40.1% compared to the same period last year; → is launching its premium ET9 model, expanding its range of offerings.
Additionally, news offering hope that high tariffs in international trade may not hinder the company's growth has also had a positive impact on NIO’s share price.
Technical Analysis of NIO’s Share Price Chart
From the perspective of candlestick analysis on the daily chart, a "Three White Soldiers" pattern (marked with an arrow) can be observed. This is considered an important bullish signal, as according to Thomas Bulkowski, author of Encyclopedia of Candlestick Charts, following the formation of a "Three White Soldiers" pattern, a bearish trend (highlighted by the red channel) reverses to the upside in 82% of cases.
However, it is important to bear in mind that resistance may be encountered at:
→ the $4 per share level, as it previously served as a support;
→ the 50% Fibonacci retracement level from the downward move between 12 March and 8 April.
This article represents the opinion of the Companies operating under the FXOpen brand only. It is not to be construed as an offer, solicitation, or recommendation with respect to products and services provided by the Companies operating under the FXOpen brand, nor is it to be considered financial advice.

NIO - the long playThere is a long road to go to see any bullishness in NIO. This diagram is a simple annotation of the steps for higher prices and bullishness on NIO. Right now we might be seeing the beginning of a shift to bullishness if we star displacing higher and price signatures such as bullish fair value gaps left open would help strengthen the bullish bias.

NIO the road to higher pricesThere is a long road to go to see any bullishness in NIO. This diagram is a simple annotation of the steps for higher prices and bullishness on NIO. Right now we might be seeing the beginning of a shift to bullishness if we star displacing higher and price signatures such as bullish fair value gaps left open would help strengthen the bullish bias.
NIO - the downtrend about to end?hi traders
Let's have a look at NIO stock.
With terrible earnings at the end of March, the price faced a strong rejection and continued a major downtrend.
On the 8th of April, due to the whole market correction, NIO dropped heavily and the price reached 3,05$, where we saw the downsloping support line playing a big role and stopping the price from further decline.
RSI was very oversold, and now it looks like it was a bottom (at least for now).
The price bounced back to 4,20$ but it seems like it's getting rejected at 100SMA line.
RSI was overbought at the moment of this rejection, so I expect the price to give a bit of pullback but overall, I expect the price to try to retest the major downsloping resistance (a yellow trendline). If it breaks the downtrend, we will see fireworks and 7$+ will be a target.
If the price gets rejected, expect another 40% drop.
NIO needs a solid catalyst, such as strong earnings. With weak fundamentals, it will be hard for the price to break this major downtrend.

Keep an eye on the trendline!NIO is starting to poke its head above trend resistance, I'd like to see it cross 5.69 to confirm the downtrend breakout. if that can come then a rally to 9 can come soon. 15+ is very optimistic.
Boost and follow for more! 🔥chart request @unixro

$NIO You're updated roadmap for $NIOcopy & paste from twitter & stocktwits:
We have to see how it develops, but expecting to see an expanded flat with a 5 wave impulse to complete this sideways correction that started April 15, 2024 before we make the final move down to complete the macro structure and unfortunately filling gaps below....cont
The TVC:HSI & NYSE:BABA appear like they will make new lows over the next 24 mo. paying closer attention when new lows are made on TVC:HSI and around 12k. I thought we found the bottom going into March/April last year but wrong as this developed into a corrective flat for NYSE:NIO
lastly the volume profile isn't capturing the correct data - if we view only $66.99 to the current low, there is a massive volume gap at the ~0.382 fib correcting wave W (the 5-3-5 structure) at $11.02 which is the highest tgt for this bounce & HSI finishing correction from 2007

NIO long pivot for the record $NIOWXYXZ. Z = Y @ log .618
they wanted a longer description so.. long pivot on deck, bullish divergences multiple timeframes. I like to have fibs AND geometry supporting the count as shown on the chart but it lacks geometry. the 5-3-5 zz we want to see in wave Z is a harder sell but im running with this anyway. Weekly timeframe looks obvious but we can nit pick on tiny timeframes.

$NIO downtrend or recover?Looking at the daily chart, it's obvious that the 30/60 EMA crossover with downward movement likely confirms that the price hasn't finished dropping and is heading toward new lows. The decline began on 10/28/2024, and at some point, the price tried to pull out of its steep dive on 03/11/2025 - even showing some volume - but it was all in vain. After forming a cup pattern, the price never completed the handle formation and simply slid downward.
A couple of scenarios could play out from these lows: it might suddenly shoot upward, signaling that it won't return to the downtrend in the near future, or alternatively, it could continue "testing the bottom" and provide a good entry point below $2.38. The volumes of recent trading sessions add to this suspicion - it feels like deliberate selling pressure, or perhaps dumping based on fears about Trump's new tariffs.


NIO bottomed out or nothi traders,
Some time ago we shared the trading idea:
but this NIO set-up failed as the stop loss at 4,05 was reached.
Since then, NIO dropped 22%.
I see a potential that a local bottom is in as RSI hit oversold levels and the price is kind of respecting the downsloping channel.
I won't be calling any huge reversal yet because NIO has a lot to prove but expecting the bounce towards 4,90-5$ is reasonable here.
However, if the price drops and closes below 3,10$ , this set-up will be invalidated.

23R NIO LongExpecting a big move up in NIO to start happening imminently. I think it’s bottomed.
Have seen an ABC correction in support.
Trade rating 8/10
Risk to reward rating 9/10
Probability 7/10

Nio Will Go Long Be Patient Price needs a 4th touch of support. Patience will be key to this entry. Once confirmed with a lower timeframe I will update the trade. This will be a longterm hold.

NIO will follow BABA hi traders,
BABA has been pumping for the last few days.
NIO is a lagger and the price remains under the downsloping resistance line.
Once we get a successful breakout, expect the rocket to launch.
72% gains in the next weeks are very likely.
Don't miss it out!

NIO Charging UpNIO looking 🔥
Up up up — this weekly dip is a gift.
Strong support holding, volume picking up, and momentum building.
This is a textbook buy point on the weekly.
Charging up for the next run. ⚡️

Falling Wedge, a bullish caseMy previous analysis back on Nov 2024 hit its' target support around 3.70 and is currently proving to be a good support. Assuming this holds for the next few days, I would expect this to traverse within this falling wedge and should compress along. If it this upward and confirms, I'd expect resistance around5.54. If it continues, should have another resistance around 7.00.
I would watch to see what the indicators reveal as this progresses. But as it stands today, it may have found the floor.
