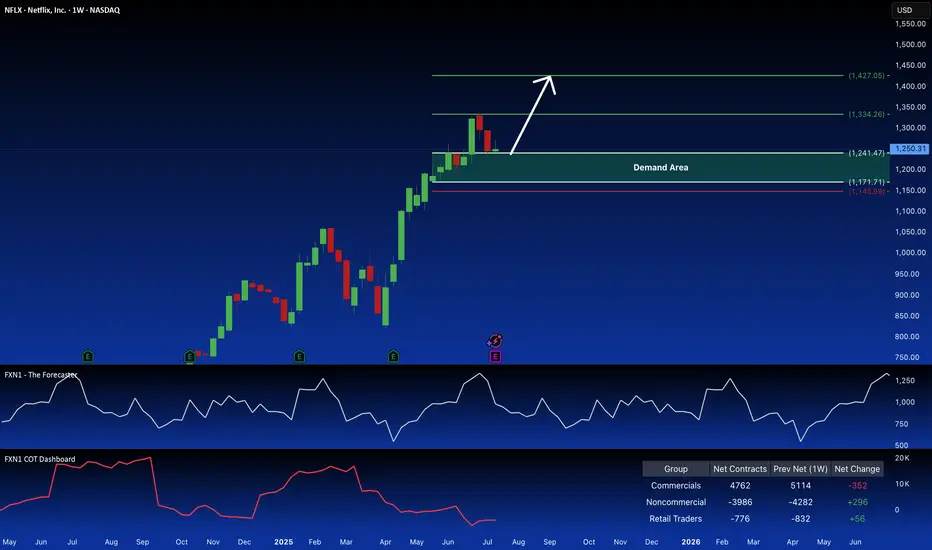
NFLX: Bullish Signal in Demand ZoneNetflix (NFLX) recently retraced within a key weekly demand zone, potentially presenting a long opportunity. Non-commercial traders are also accumulating long positions in the stock. This suggests a possible bullish setup. Your thoughts?
✅ Please share your thoughts about NFLX in the comments section below and HIT LIKE if you appreciate my analysis. Don't forget to FOLLOW ME; you will help us a lot with this small contribution.
NFC trade ideas
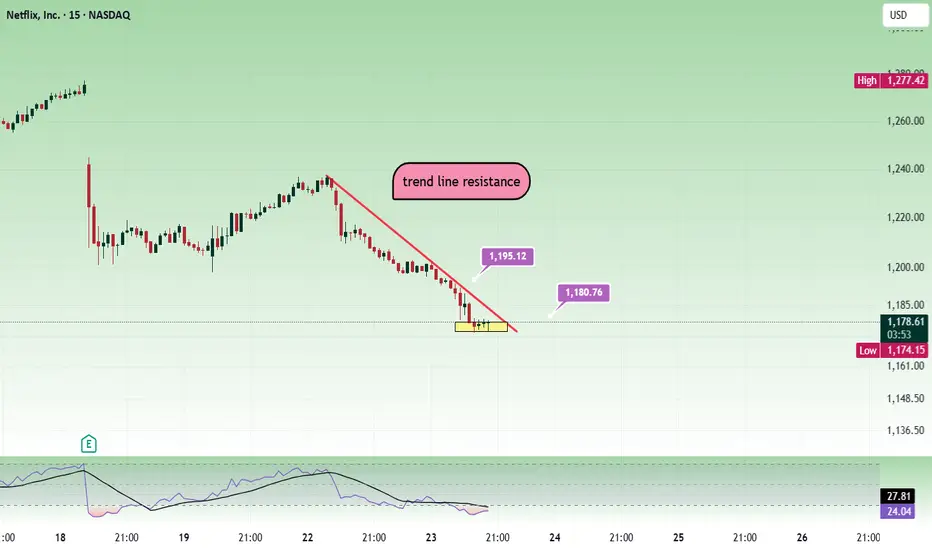
NetflixMay be people are not watching Netflix nowadays and the price is falling. 1200 is a strong resistance.
Sell below 1180 with the stop loss of 1195 for the targets 1165, 1150, 1130 and 1115.
Price can pull back towards 1190 and then fall. Its better to see bearish confirmation and trade.
Always do your own analysis before taking any trade.
NFLX TRADE IDEA (07/24)
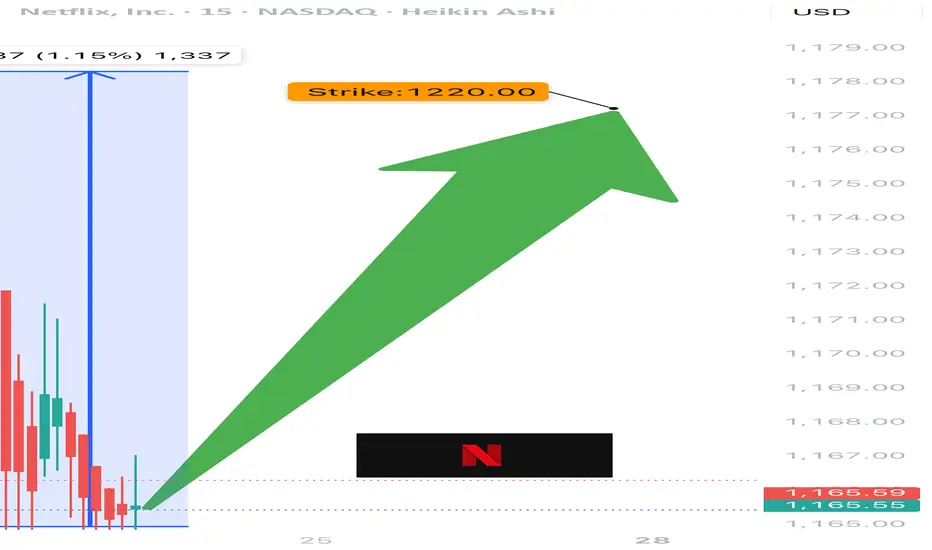
🚨 NFLX TRADE IDEA (07/24) 🚨
⚔️ Bulls vs. Bears… but calls are winning 🐂📈
🧠 Quick Breakdown:
• Call/Put Ratio: 1.27 → bullish edge
• RSI < 45 = 🔻oversold territory
• VIX favorable = room to run
• High gamma = big moves incoming ⚡️
• Expiry: TOMORROW = 🔥 time decay risk
💥 TRADE SETUP
🟢 Buy NFLX $1220 Call exp 7/25
💰 Entry: $0.50
🎯 Target: $0.90
🛑 Stop: $0.30
📈 Confidence: 65%
⚠️ Watch volatility closely. Fast exit = smart exit.
#NFLX #OptionsFlow #OptionsAlert #BullishPlay #DayTradeSetup #NetflixStock #TechOptions #UnusualOptionsActivity #TradingView #GammaSqueeze
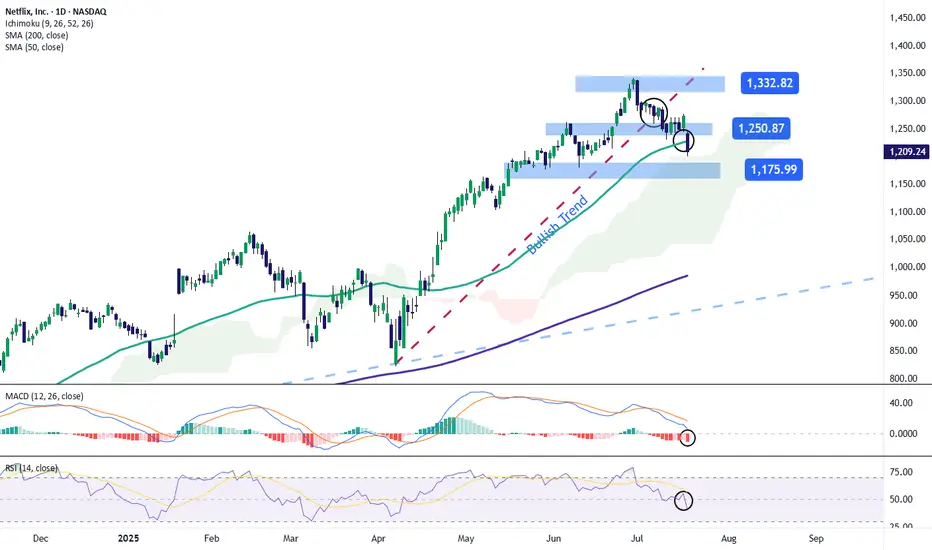
Netflix Stock Drops After Earnings ReleaseShortly after publishing its financial results, Netflix posted a decline of over 5% toward the end of the week and continues to show a strong bearish bias. This comes despite reporting a positive earnings per share (EPS) figure of $7.19, beating the expected $7.08, and revenue of $11.08 billion, slightly above the forecast of $11.07 billion.
However, in its post-earnings communications, the company stated that it expects very moderate growth for the remainder of the year. It also warned that the positive indicators could begin to compress due to increased spending on marketing and content, which has ultimately weakened the impact of the solid financial results. As a result, the stock faced persistent selling pressure heading into the weekly close.
Uptrend Breaks
Over the past few weeks, starting in early April, the stock had followed a steady uptrend, pushing the price above $1,300. However, continued bearish corrections have now brought the price down to the $1,200 area, causing a clear break in the previous uptrend. This breakdown could further strengthen the bearish pressure in the coming sessions if the negative sentiment persists.
MACD
The MACD histogram continues to move below the zero line, and as it drifts further from this level, it signals a steady bearish momentum that could remain dominant in the near term if the trend continues.
RSI
The RSI line has broken sharply below the neutral 50 level, indicating a clear dominance of bearish momentum in the market. As long as it does not reach oversold territory, this move may suggest a continued increase in short-term selling pressure.
Key Levels:
1,332 – Recent High: This is the most important resistance level. If price action returns to this area, it could reactivate the previous uptrend, which had been weakening on the chart.
1,250 – Nearby Resistance: A barrier defined by the most recent neutral zone. It may act as a temporary ceiling against short-term bullish corrections.
1,175 – Key Support: A critical level located below the 50-period simple moving average. If the price breaks below this level, it could strengthen a bearish bias and trigger a more consistent downtrend.
Written by Julian Pineda, CFA – Market Analyst
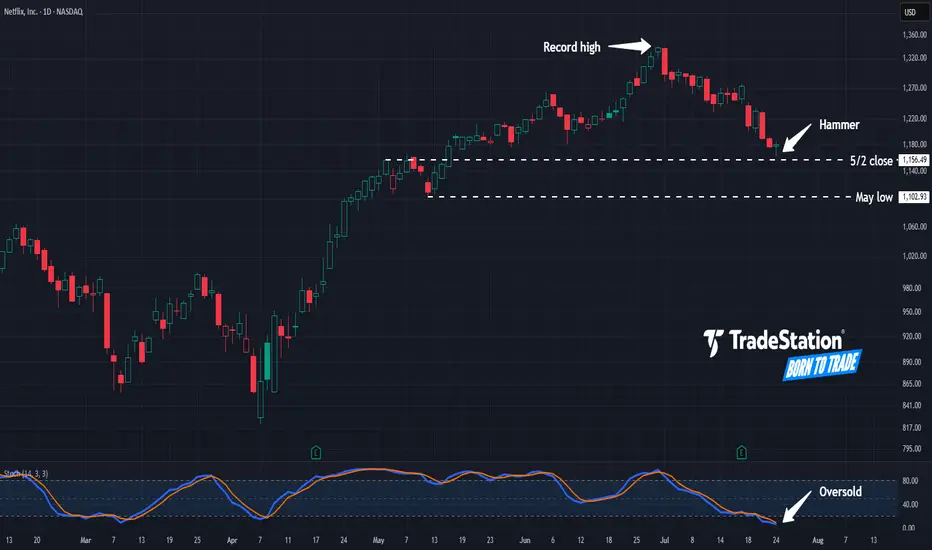
Hammer in NetflixNetflix has pulled back from record highs, and some traders may see potential opportunities in the streaming video giant.
The first pattern on today’s chart is the $1,156.49 level. It was a weekly close on May 2 and near the high the following week. NFLX is now showing signs of potential stabilization near that level. Is new support emerging?
Second, prices hit their lowest level in more than two months yesterday but rebounded. The resulting hammer candlestick pattern may be viewed as a bullish reversal pattern.
Third, stochastics have fallen to oversold territory.
Fourth, if the potential support at $1,156.49 breaks, traders may next eye the May low of $1,102.93.
TradeStation has, for decades, advanced the trading industry, providing access to stocks, options and futures. If you're born to trade, we could be for you. See our Overview for more.
Past performance, whether actual or indicated by historical tests of strategies, is no guarantee of future performance or success. There is a possibility that you may sustain a loss equal to or greater than your entire investment regardless of which asset class you trade (equities, options or futures); therefore, you should not invest or risk money that you cannot afford to lose. Online trading is not suitable for all investors. View the document titled Characteristics and Risks of Standardized Options at www.TradeStation.com . Before trading any asset class, customers must read the relevant risk disclosure statements on www.TradeStation.com . System access and trade placement and execution may be delayed or fail due to market volatility and volume, quote delays, system and software errors, Internet traffic, outages and other factors.
Securities and futures trading is offered to self-directed customers by TradeStation Securities, Inc., a broker-dealer registered with the Securities and Exchange Commission and a futures commission merchant licensed with the Commodity Futures Trading Commission). TradeStation Securities is a member of the Financial Industry Regulatory Authority, the National Futures Association, and a number of exchanges.
Options trading is not suitable for all investors. Your TradeStation Securities’ account application to trade options will be considered and approved or disapproved based on all relevant factors, including your trading experience. See www.TradeStation.com . Visit www.TradeStation.com for full details on the costs and fees associated with options.
Margin trading involves risks, and it is important that you fully understand those risks before trading on margin. The Margin Disclosure Statement outlines many of those risks, including that you can lose more funds than you deposit in your margin account; your brokerage firm can force the sale of securities in your account; your brokerage firm can sell your securities without contacting you; and you are not entitled to an extension of time on a margin call. Review the Margin Disclosure Statement at www.TradeStation.com .
TradeStation Securities, Inc. and TradeStation Technologies, Inc. are each wholly owned subsidiaries of TradeStation Group, Inc., both operating, and providing products and services, under the TradeStation brand and trademark. When applying for, or purchasing, accounts, subscriptions, products and services, it is important that you know which company you will be dealing with. Visit www.TradeStation.com for further important information explaining what this means.
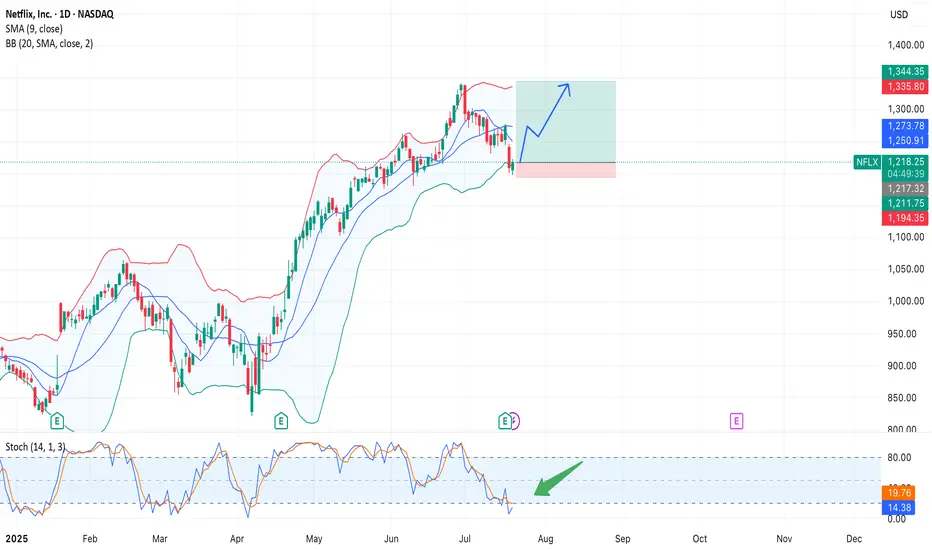
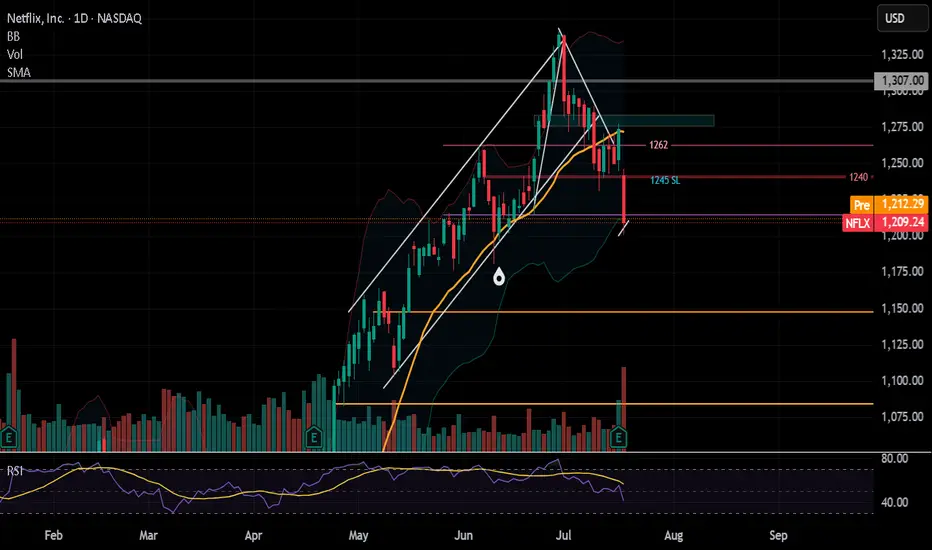
Netflix (NFLX) Long Setup – Bounce from Lower Bollinger Band $NASDAQ:NFLX. After pulling back from the $1350 area, Netflix stock is testing the lower Bollinger Band (BB 20/2σ), a level that previously acted as support.
At the same time, the Stochastic Oscillator (14,1,3) is in oversold territory and starting to curl upward, suggesting a potential bullish reversal.
Trade Setup:
• Entry: $1216 (current price)
• Target: $1283–$1300
• Stop Loss: $1194 (below BB lower band)
• Risk/Reward Ratio: 1:3+
Supporting Factors:
• Technical bounce from the lower Bollinger Band
• Price approaching SMA 9 (~$1250), potential breakout level
• Fundamental catalyst: Analysts at Baird and CICC raised their price targets to $1500 and $1350 respectively. Ad revenue is projected to quadruple by the end of 2025 due to stronger content engagement.
Risks:
• Q2 report met expectations, but weak forward guidance hurt sentiment
• A break below $1190 could lead to further downside pressure
NFLX WEEKLY BEARISH PLAY — 07/23/2025
📉 NFLX WEEKLY BEARISH PLAY — 07/23/2025
🧠 Multi-model AI Consensus Trade Setup
⸻
🔍 QUICK SUMMARY
After reviewing 5 AI model reports (Grok, Gemini, Claude, Meta, DeepSeek), the consensus is moderate bearish for NFLX this week following heavy institutional selling and post-earnings weakness.
💣 Key Reason:
All reports cite declining daily RSI, strong institutional outflows, and mixed-to-bearish volume trends. Despite some caution, the majority lean bearish.
⸻
🎯 TRADE IDEA (WEEKLY PUT PLAY)
{
"instrument": "NFLX",
"direction": "PUT",
"strike": 1135,
"entry_price": 0.77,
"profit_target": 1.50,
"stop_loss": 0.41,
"expiry": "2025-07-25",
"confidence": 70%,
"entry_timing": "Open",
"size": 1 contract
}
⸻
📊 TRADE PLAN
🔹 🔸
🎯 Strike 1135 PUT
💵 Entry Price 0.77
🎯 Target 1.50 (approx. 95% upside)
🛑 Stop Loss 0.41
📅 Expiry July 25, 2025 (2DTE)
📈 Confidence 70%
⏰ Entry Market Open
🧠 Gamma Risk High (be nimble!)
⸻
🧠 Model Summary
• Gemini/Google: 🔻 Strong SELL — Institutional unload, 85% confidence
• Grok/xAI: ⚠️ NO TRADE — mixed signals
• Claude/Anthropic: ⚠️ NO TRADE — high sell volume, but conflicting indicators
• Meta/LLaMA: 🔻 Moderate Bearish — suggests 1175P but supports this setup
• DeepSeek: 🔻 Bearish lean — supports 1135P w/ caution on gamma/time decay
⸻
🚨 NOTES
• 🕒 Only 2DTE — expect volatility + fast decay
• 🔍 Watch price action into open + first 30 mins
• 📉 If NASDAQ:NFLX cracks below $1130 support zone, this setup could fly
⸻
💬 Drop a ⚠️ if you’re watching
💣 Drop a 🔻 if you’re in this PUT
📈 #OptionsTrading #NFLX #WeeklyTrade #AITradeAlert #MemeStocks #PutOptions #ShortSetup

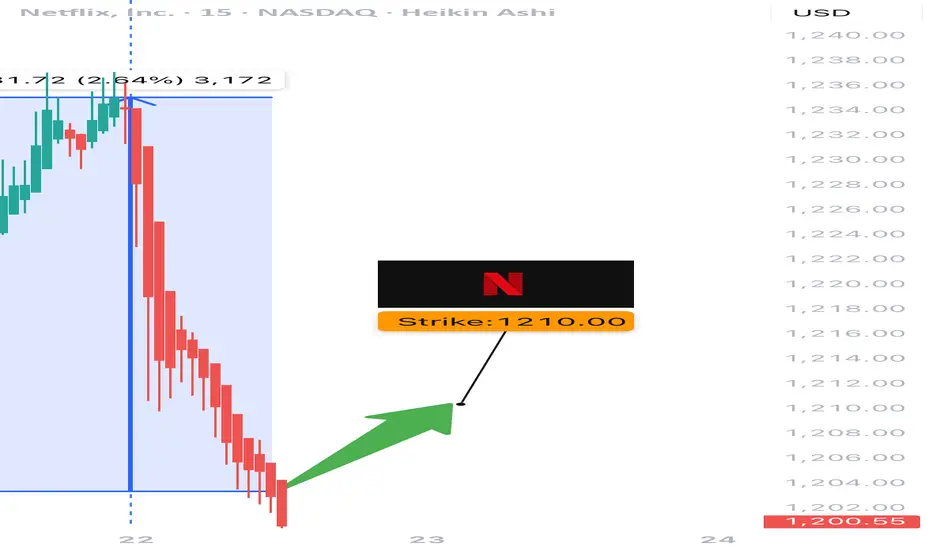
$NFLX Weekly Call Setup – 07/22/25
🚀 NASDAQ:NFLX Weekly Call Setup – 07/22/25
Volume Surge 📈 | RSI Bullish ✅ | Options Flow Mixed 🔁 | 3DTE Lotto Play 🎯
⸻
📊 Market Snapshot
• Price: $1203.16
• Call/Put Ratio: 1.01 → ⚖️ Neutral
• Weekly RSI: ✅ 63.2 (Momentum confirmed)
• Volume Surge: 📈 1.6x previous week
• Gamma Risk: ⚠️ Moderate
• DTE: 3 (Theta decay accelerating)
⸻
🧠 Trade Setup
{
"Instrument": "NFLX",
"Direction": "CALL",
"Strike": 1210.00,
"Entry": 24.10,
"Profit Target": 7.00,
"Stop Loss": 12.00,
"Expiry": "2025-07-25",
"Confidence": 0.65,
"Size": 1,
"Entry Timing": "Open"
}
⸻
🔎 Sentiment Breakdown
Indicator Status
📈 Weekly RSI ✅ Bullish confirmation
📉 Daily RSI ⚠️ Flat – no momentum edge
🔊 Volume ✅ Surge (1.6x baseline)
🔁 Options Flow ⚖️ Neutral (C/P = 1.01)
💨 VIX ✅ Favorable for calls
📰 News Risk ❌ Downgrade noise = volatility
⸻
📍 Chart Zones to Watch
• Support: $1198
• Breakout Trigger: $1210
• Resistance Targets: $1220 → $1250
• ⚠️ Key Watch: Gamma acceleration if $1210 breaks with volume
⸻
🎯 Viral Caption / Hook (for TV/X/Discord):
“ NASDAQ:NFLX 1210C is riding a volume rocket. RSI says go — options flow says maybe. Gamma vs. downgrade risk. 3DTE = Lotto edge or fade?”
💵 Entry: $24.10 | 🎯 Target: +30–50% | 📉 Stop: $12.00 | ⚖️ Confidence: 65%
⸻
⚠️ Best For:
• 📊 Breakout traders riding weekly momentum
• 🚀 Volume chasers following RSI confirmation
• ⏳ Scalpers with a handle on 3DTE gamma dynamics
⸻
💬 Want a debit spread alternative (e.g., 1200/1225)? A theta-scalped condor? Or 0DTE lotto scalp?
Drop a comment!!!
Watching: NFLXKeep an eye on NFLX. It is setting up for a potential bounce if we can get a close above the 5-SMA. Cheers!

How Earnings Reporting Could Impact Netflix (NFLX) Share PriceHow Earnings Reporting Could Impact Netflix (NFLX) Share Price
Earnings season is gaining momentum. Today, after the close of the main trading session, Netflix (NFLX) is set to release its quarterly financial results.
Analysts are optimistic, forecasting earnings per share (EPS) of $7.08, up from $4.88 a year earlier, and revenue growth to $11.1 billion.
The upbeat sentiment is driven by:
→ the fact that Netflix’s business model is relatively resilient to tariff-related pressures;
→ the company’s success in curbing password sharing and promoting a more affordable ad-supported subscription tier.
Netflix has reported revenue growth for six consecutive quarters, outperforming competitors such as Disney, Amazon, and Apple. Its market share has climbed to 8.3%, with YouTube remaining its only serious rival—YouTube's share increased from 9.9% a year ago to 12.8% in June, according to Nielsen. If current trends hold, this reporting quarter could mark another strong performance for Netflix.
However, is the outlook truly that bullish?
Technical analysis of NFLX stock chart
The NFLX stock price is currently moving within an ascending channel (marked in blue), and it is now testing the lower boundary of this formation. Of concern is the recent pronounced bearish movement (B), which has dragged the stock from the channel’s upper boundary to its lower edge—erasing the bullish momentum (A) that followed the breakout above the $1,250 resistance level.
What’s next?
→ On the one hand, bulls may attempt to resume the upward trend within the channel.
→ On the other hand, bears could build on their recent momentum (highlighted in red) and break the ascending trend that has been in place since May.
It appears the fate of the current uptrend hinges on the market’s reaction to today’s earnings release.
This article represents the opinion of the Companies operating under the FXOpen brand only. It is not to be construed as an offer, solicitation, or recommendation with respect to products and services provided by the Companies operating under the FXOpen brand, nor is it to be considered financial advice.
NFLX weak... gapping up to head back downWatching Monday... looking for continuation to downside. This week into next week. 1245 zone is where the post earnings gap down and go started. Using this as my stop loss.
Targets 1200 down to 1180.
Netflix Wave Analysis – 21 July 2025
- Netflix reversed from support zone
- Likely to rise to resistance level 1275.00
Netflix recently reversed up from the support zone between the support level 1200.00 (which stopped wave 4 at the start of June), lower daily Bollinger Band and the upper trendline of the daily up channel from October.
The upward reversal from this support zone stopped the earlier downward impulse wave C from the middle of July.
Given the strong daily uptrend, Netflix can be expected to rise further to the next resistance level 1275.00 (top of the minor correction B).

NFLX eyes on $1215-1232: poised for next leg UP with earningsNFLX broke and retested a key resistance zone.
Loud PING's on two major fibs announced support.
It is perfectly set to LAUNCH if earnings are good.
Positive earnings may push to mid $1500's above.
Negative may drop to $1061 Golden Genesis below.
Neutral report should continue uptrend from here.
.
See "Related Publications" for previous charts such as this BOTTOM CALL:
============================================
.
Netflix: Hovering Just Below Key Target ZoneNetflix has rebounded over the past two sessions after falling below the beige Short Target Zone ($1,270–$1,432) and is now trading just beneath it. A renewed push into this range could complete turquoise wave 3, followed by a corrective wave 4 likely dipping below $1,180. Alternatively, with a 33% probability, turquoise wave alt.3 may already have peaked, opening the door for an immediate drop through $1,180. A broader correction in beige wave IV is expected once wave III concludes, before upside resumes in wave V.
📈 Over 190 precise analyses, clear entry points, and defined Target Zones - that's what we do (for more: look to the right).

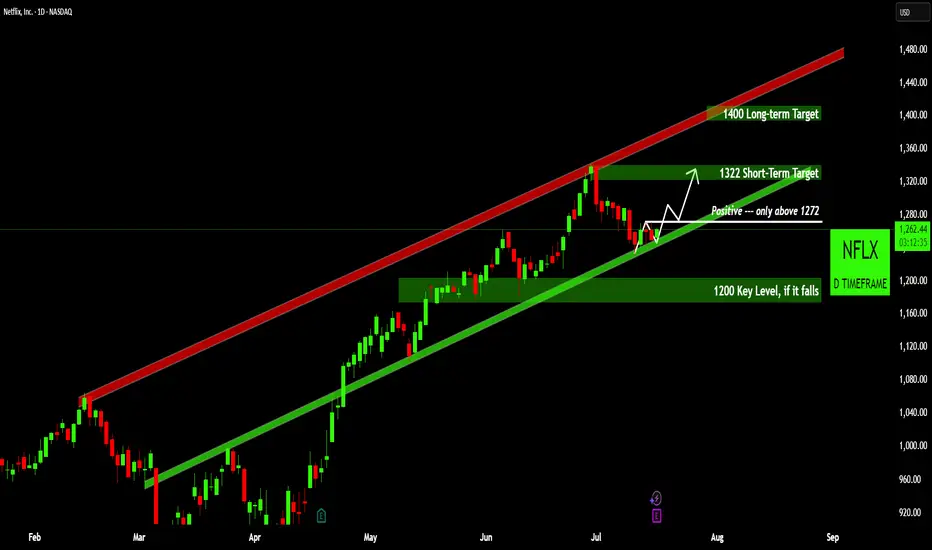
NFLX: Bullish Consolidation - Is a Move to $1322 Imminent?Overall Trend: Netflix is currently demonstrating a strong uptrend, effectively trading within a well-defined ascending channel since late February. This indicates robust buying interest and consistent higher highs and higher lows.
Key Support & Resistance: The $1200 level is acting as a crucial support zone, marked by a green shaded area where price previously found buyers. The stock is currently consolidating around the trendline support of the ascending channel.
Breakout Potential: A decisive breakout above $1272 (white horizontal line) would signal a continuation of the upward momentum, potentially leading to a retest of higher levels.
Price Targets: Should the breakout occur, the immediate short-term target is $1322. For a more extended outlook, the long-term target is $1400, residing at the upper boundary of the established ascending channel.
Disclaimer:
The information provided in this chart is for educational and informational purposes only and should not be considered as investment advice. Trading and investing involve substantial risk and are not suitable for every investor. You should carefully consider your financial situation and consult with a financial advisor before making any investment decisions. The creator of this chart does not guarantee any specific outcome or profit and is not responsible for any losses incurred as a result of using this information. Past performance is not indicative of future results. Use this information at your own risk. This chart has been created for my own improvement in Trading and Investment Analysis. Please do your own analysis before any investments.
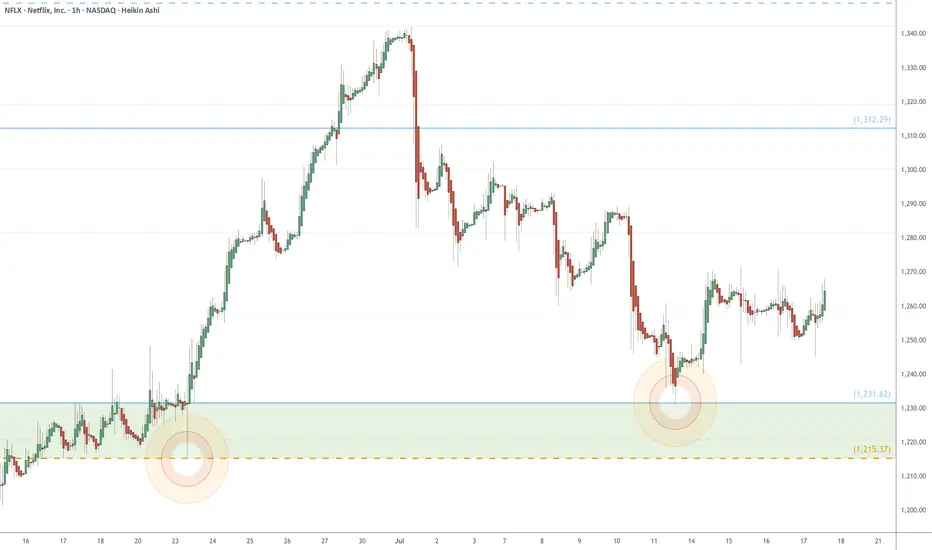
NFLX Price ActionNASDAQ:NFLX showing strong bearish momentum on the 1H. If it breaks below the key $1230 level, next support sits near $1215 — watch for continuation flush 👀🔥

Netflix Faces Rising Volatility and Bearish Technicals Ahead of Netflix (NASDAQ: NFLX) will announce its results after the close of trading in New York on Thursday, 17 July. Analysts forecast the NASDAQ-listed streaming media company to report second-quarter earnings growth of 45%, reaching $7.08 per share, while revenue is expected to increase by 15.6%, amounting to $11.1 billion. Net subscriber additions are predicted to decrease by 42.9%, falling to 4.6 million.
For the third quarter, analysts forecast guidance for revenue of $11.3 billion, up 14.7%, and earnings of $6.68 per share, reflecting growth of 23.6%. The options market is pricing in a 6.4% move, either up or down, in Netflix shares following the earnings report.
The significant expected move in the stock is driven by implied volatility levels for options expiring on 18 July, which were high at nearly 70% as of the 13 July close and are likely to increase further as results approach. Options positioning in Netflix also appears notably bullish, with call delta values surpassing put delta values. This indicates that once the company reports its results and options begin to decrease in value due to the decay of implied volatility, market makers might find themselves overly hedged on the long side, potentially forcing them to sell shares. This scenario could exert downward pressure on the stock if it fails to breach the $1,300 level, which acts as the gamma call wall.
Additionally, technical analysis shows a downside risk for the shares both before and after the results. The Relative Strength Index (RSI) for Netflix has been trending lower and recently dropped below 50, signalling a shift in momentum from bullish to bearish. Furthermore, the stock has broken down from a rising broadening wedge pattern, which is traditionally seen as a bearish reversal signal, indicating a possible decline back towards the pattern’s origin, around $1,100.
Written by Michael J. Kramer, founder of Mott Capital Management.
Disclaimer: CMC Markets is an execution-only service provider. The material (whether or not it states any opinions) is for general information purposes only and does not take into account your personal circumstances or objectives. Nothing in this material is (or should be considered to be) financial, investment or other advice on which reliance should be placed.
No opinion given in the material constitutes a recommendation by CMC Markets or the author that any particular investment, security, transaction, or investment strategy is suitable for any specific person. The material has not been prepared in accordance with legal requirements designed to promote the independence of investment research. Although we are not specifically prevented from dealing before providing this material, we do not seek to take advantage of the material prior to its dissemination.

Bulls Quit? Bears Ready! - Netflix Stock (USA) - {27/07/2025}Educational Analysis says that Netflix (USA Stock) may give trend Trading opportunities from this range, according to my technical analysis.
Broker - NA
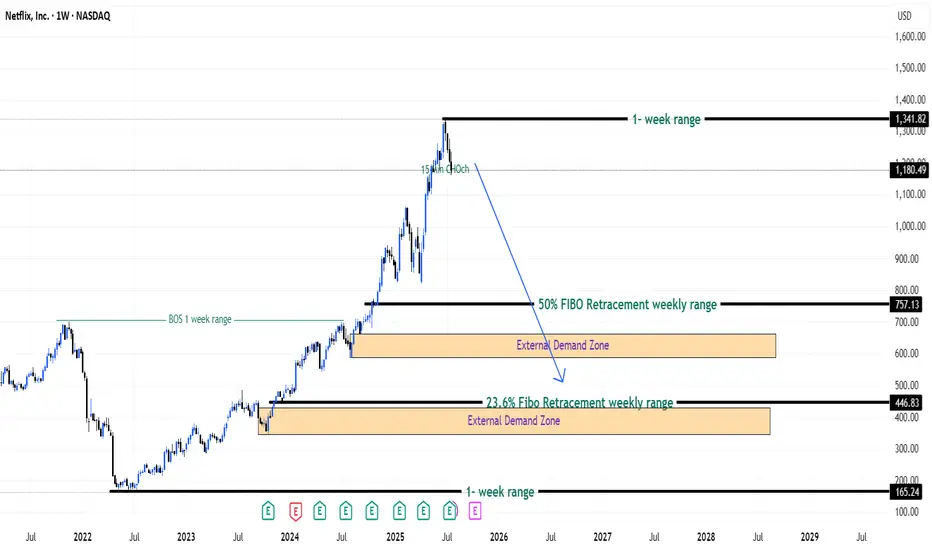
So, my analysis is based on a top-down approach from weekly to trend range to internal trend range.
So my analysis comprises of two structures: 1) Break of structure on weekly range and 2) Trading Range to fill the remaining fair value gap
Let's see what this Stock brings to the table for us in the future.
DISCLAIMER:-
This is not an entry signal. THIS IS FOR EDUCATIONAL PURPOSES ONLY.
I HAVE NO CONCERNS WITH YOUR PROFITS OR LOSS,
Happy Trading,
Stocks & Commodities TradeAnalysis.
My Analysis is:-
Short term trend may be go to the external demand zone.
Long term trend breaks the new high after going from discount zone.
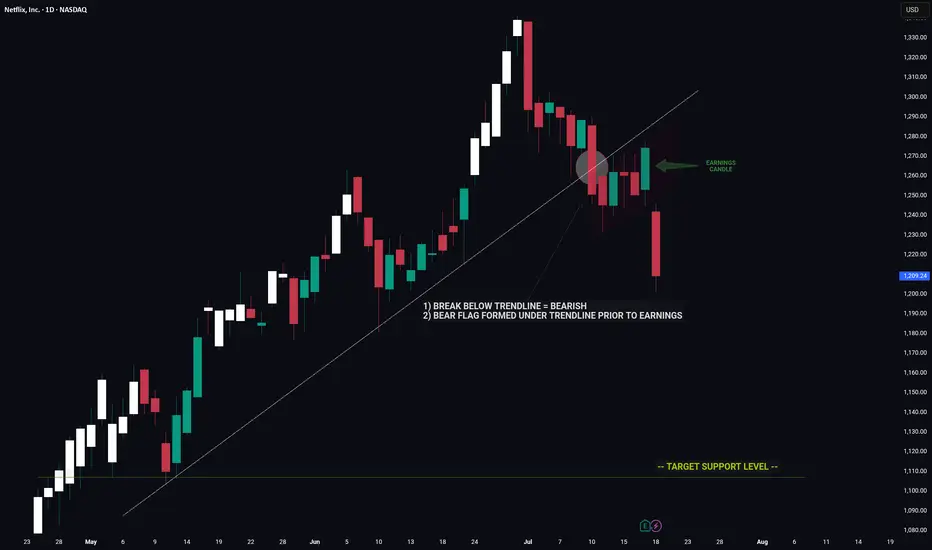
NETFLIX -- Price Signaled A Move Lower Prior To EarningsHello Traders!
The chart of NFLX is a great example of using clues to decipher a future move.
Prior to earnings we had major bearish indicators on the chart that hinted towards a move down on earnings.
1) Break below major trendline
2) Bear flag
These two signals by themselves are very bearish however the fact that these signals appeared coming into earnings was an even strong indicator of a potential for negative move.
Now that the upward trend is broken NFLX has a long way to fall before reaching the next key support level.
Thanks everyone and best of luck on your trading journey!
Netflix is going to fall sharply soonNetflix is in the huge 5th wave extension. I expect it to complete wave (v) of 5 very soon, probably within the next week.
RSI divergence on 3-days, weekly frames is quite visible and supports the upcoming trend reversal.
When wave 5 is extended, retracement typically goes to the bottom of wave (ii) of this 5th wave. This would mean 1180-1195 USD to end the wave 5. Also, at this price wave 5 will be 2.168 times bigger than waves 1 and 3 together.

NFLX CRACK!!Classic breakdown move from a rising F flag!
Massive Head and shoulders formed, that head test followed through, taking out stops, and now failing off the top of the channel.
Screaming CAUTION to the bulls!
Nice simple short setup for bears.
Click boost, follow, and subscribe. Let's get to 5,000 followers. ))

NETFLIX 1D MA50 test is a new buy opportunity.Netflix (NFLX) has been rising non-stop since the April 07 bottom on the 1D MA200 (orange trend-line). This bottom has been the latest Higher Low of the 3-year Channel Up that started on the June 14 2022 bottom.
This kickstarted its third long-term Bullish Leg. The previous two have been fairly similar (+210% and +195.93%) so we can assume a minimum total rise of +195.93% until the next top (Higher High of the Channel Up).
We can also see that on each Bullish Leg, after the initial rebound, the stock always tested the 1D MA50 (blue trend-line) around the 0.236 Time Fibonacci level. That has always been the best buy opportunity of that stage.
As a result, we believe that the recent short-term correction is a buy opportunity in disguise, targeting a Higher High at $2200.
Check out our previous analysis on Netflix:
-------------------------------------------------------------------------------
** Please LIKE 👍, FOLLOW ✅, SHARE 🙌 and COMMENT ✍ if you enjoy this idea! Also share your ideas and charts in the comments section below! This is best way to keep it relevant, support us, keep the content here free and allow the idea to reach as many people as possible. **
-------------------------------------------------------------------------------
💸💸💸💸💸💸
👇 👇 👇 👇 👇 👇

NFLX Bear Call Spread Near Max Profit – Watching 61.8% Fib Zone📉 I'm currently holding a Bear Call Spread 1300/1280 expiring on Jul 18. After multiple Breaks of Structure (BOS) and strong rejection from 1300, price is trending toward a key 1H demand zone near the 61.8% Fibonacci retracement (1242).
📊 Technical Context:
Bearish CHoCH + BOS confirms short-term trend reversal
Clear rejection from 1280–1300 supply
1242 = strong confluence: Fib + demand zone
🎯 Plan:
Hold the spread close to expiration for max profit
Close before earnings on Jul 17 to avoid volatility
If price shows strength at 1242, I may flip bias and look for a bull call spread post-earnings
🔔 TradingView Alerts:
1242: “Watch for bullish reaction at demand zone”
1278: “Rebound in progress – reassess post-earnings”
📌 This is a two-stage plan: secure gains on the short side, then prepare for potential upside.
➡️ Follow me for more structured trade ideas based on price action, options, and macro timing.
