NFLX Monthly Chart... 5 trading days to go before the close of the month... which means this last bearish candle that broke the current uptrend can still reverse... let's wait and see.. but currently it is quite bearish... adding the doji that occurred at the .618 Fibonacci retracement level (in red), the RSI not even reaching 60 before reversing and the MACD histogram starting to break down.
Zoom out and NFLX is still on a major long term uptrend... even if the price would drop substantially.
NFC trade ideas

Looking for a potential shark to formThis would also line up perfectly with a great support...
This could be beautiful. Time will tell.

NFLXNFLX is in bearish trend but a big bullish divergence shown in bottom of the trend which we will hope that the trend will be reversal from here..
We further confirm if it breaks the last LH and made first HH.
NFLX - AnalysisNFLX
W1 - After breaking through the trend line, a head and shoulders pattern is formed. If this changes the direction of the trend, we could see moves towards the 285.54 levels in the long term.
If this is a correction, we could see the price move towards the 348.15 level. If the price retests the level of 379.10, then the road is open to a fall to lower targets.
What can you expect?
Movement to the levels 379.10 - 348.15 - after breaking through 379.10, the price may begin a correction to consider buying, awaiting confirmation.
Short
Targets – 379.10 - 362.83 - 348.15
Long-term perspective (retest required) – goals 348.15 - 314.88 - 285.54
Long - will be considered when the situation changes.

NFLX - Expecting Strong Support @ 380Since it began trendng more than a year ago from July 2022, NFLX has a tentancy to correct back to its rising trendline every 3 to 6 months or so.
As at its close @ about 400 yesterday, it has already corrected 50% from it's recent AB swing. Whether it will find support here remains to be seen.
Another 5% downside from here would bring it to 380, which is likely to be a strong support due to a confluene of:
1. Long term trendline support (Red)
2. Horizontal Resistance turning Support (Black)
3. 61.8% fib retracement of it's AB swing
4. Gap close (minor)
All long bets are off should it break and stay below 380.
Disclaimer:
TA is about improving our odds of a successful trade (not a guarantee). This is just my own analysis and opinion for discussion and is NOT a trade advice. Kindly do your own due diligence and trade according to your own risk tolerance and don't forget that money management (ie stop loss and position sizing) is (probably the most) important!
Take care and Good Luck!

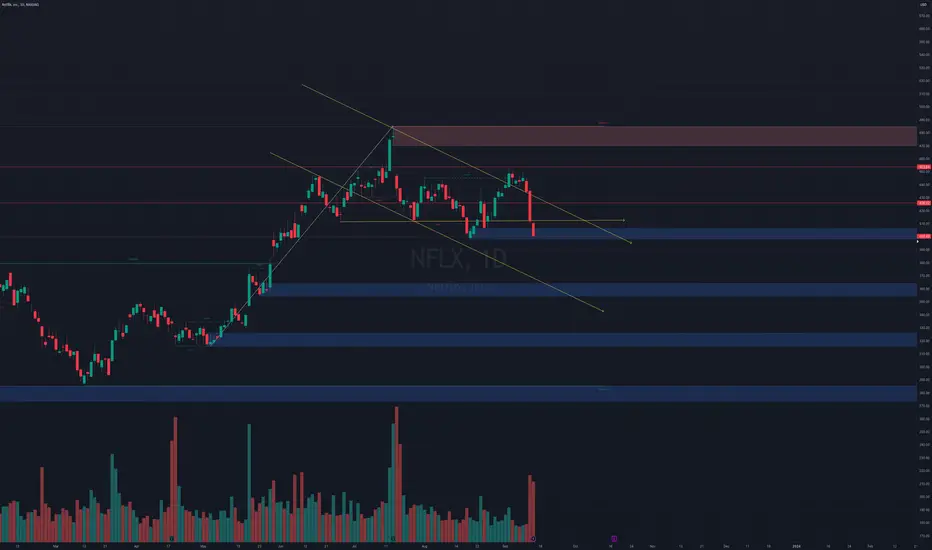
Bearish Alert : NFLXNew double bearish alert together with negative price action on the daily chart.
EMAS are testing each other right now. The downside may see an extension to $367 / $348

NFLX AnalysisOne of the longest red streaks we've seen on this name in awhile.. due for a relief bounce soon. However, I can only count 3 waves down so far from the 9/5 high.

Netflix Breaking Major Support Not a Good look Hi guys! This is an Update on Netflix (NFLX) on the 1 day chart.
We are currently at risk of a trend change in the makings due to a breakdown of Major Support.
This is a zoomed in look on the daily timeframe.
But if you look at my previous idea below, notice the Uptrend Channel that Netflix has been following since June 2022.
Todays candle is currently BELOW this Support trendline of the Channel.
Not a good look for Netflix.
But brings in opportunity for take a Short, once confirmation comes in.
Notie also that with the print of the Massive BEARISH Engulfing Candle, we are now below the 21 EMA.
Note the BEARISH Engulfing Candle indicates extreme selling pressure. It shows that the majority of the previous move up to the resistance was sold off by this 1 candle print.
With this daily candle & the engulfing candle it equates to the entirety of that move.
Being BELOW the 21 EMA, tells us declines are likely ahead of us. ALso if we are where we are with the close of our current daily candle, we will confirm BELOW 21 EMA.
Thus supporting probability of further declines.
Look to the Black Horizontal Line below us for our current target for this price decline.
BUT if we can somehow move back ABOVE the channel, by the end of the week before CONFIRMATION. This could support the probability of us resuming our Uptrend.
__________________________________________________________________________________
Thank you for taking the time to read my analysis. Hope it helped keep you informed. Please do support my ideas by boosting, following me and commenting. Thanks again.
Stay tuned for more updates on NFLX in the near future.
If you have any questions, do reach out. Thank you again.
DISCLAIMER: This is not financial advice, i am not a financial advisor. The thoughts expressed in the posts are my opinion and for educational purposes. Do not use my ideas for the basis of your trading strategy, make sure to work out your own strategy and when trading always spend majority of your time on risk management strategy.

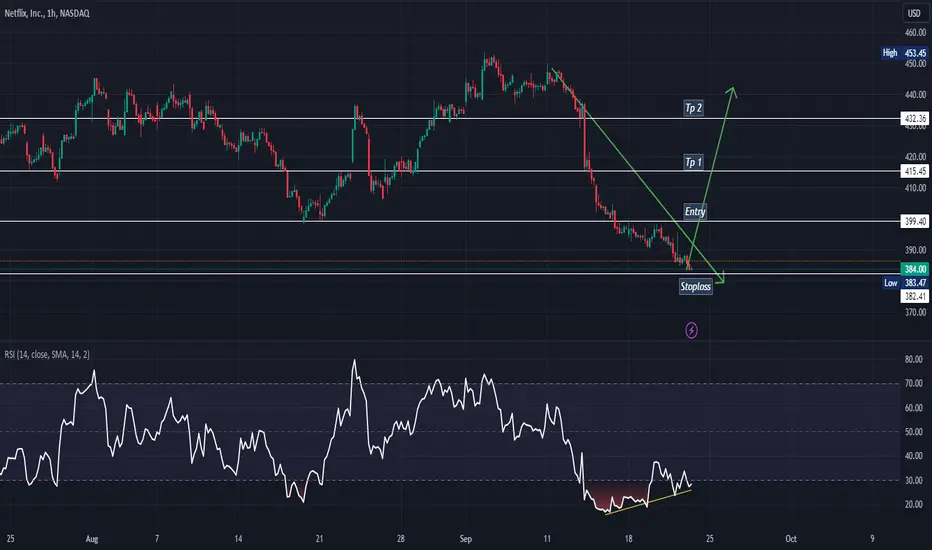
Buying netflix big divergence at 396Big play here on netflix, nice bull flag with big MACDH divergence on the hourly.
Looking for 412.

NFLX heavy drop.. will have bouncing at 395 ???#NFLX was dropped over my expectation.( 430$)
Next support : 398$/395$, i expect have bouncing from 395$.
Strong resistance : 411$.
If #nflx can hold 395, it will continueing drop up to 380-382$
What if?? Can NFLX reverse and rise?The current secondary downtrend has already shown signs of reversal with the latest correction leg breaking the previous top.
If prices stop at the purple rectangle (33-66% reaction) and break the previous top we will have a confirmed reversal pivot.
With this, the possibility of a new primary uptrend leg arises.

Netflix (NFLX) Looking for Double CorrectionNetflix (NFLX) decline from 7.20.2023 high is unfolding as a double three Elliott Wave structure. Down from 7.20.2023 high, wave (A) ended at 411.88 and rally in wave (B) ended at 445.25. Wave (C) lower ended at 398.15 which completed wave ((W)). Rally in wave ((X)) ended at 453.53 with internal subdivision as a zigzag strcuture. Up from wave ((W)), wave (A) ended at 437.02 and pullback in wave (B) ended at 404.50. Wave (C) lower took the form of a 5 waves impulse which ended at 453.53 as the 30 minutes chart below shows. This completed wave ((X)) in higher degree. The stock then turned lower in wave ((Y)).
Down from wave ((X)), wave 1 ended at 436.7 and rally in wave 2 ended at 449.89. Internal subdivision of wave 2 unfolded as a zigzag. Up from wave 1, wave ((a)) ended at 446.81, pullback in wave ((b)) ended at 438.85 and wave ((c)) higher ended at 449.88 which completed wave 2. Down from wave 2, wave ((i)) ended at 429.17 and wave ((ii)) ended at 437.59. Wave ((iii)) ended at 414.81 and wave ((iv)) ended at 421.55. Expect the stock to extend lower in wave ((v)) which should complete wave 3. Afterwards, it should rally in wave 4 before another leg lower to end wave 5 of (A). Near term, as far as pivot at 453.53 high stays intact, expect rally to fail in 3, 7, or 11 swing for further downside.

NFLX Entry, Volume, Target, StopEntry: with price above 448.66
Volume: with volume greater than 7.1M
Target: 510.38 area
Stop: Depending on your risk tolerance; Based on an entry of 448.66, 428.10 gets you 3/1 Reward to Risk Ratio.
This swing trade idea is not trade advice and is strictly based on my ideas and technical analysis. No due diligence or fundamental analysis was performed while evaluating this trade idea. Do not take this trade based on my idea, do not follow anyone blindly, do your own analysis and due diligence. I am not a professional trader.

NFLX, Breakout Of The Triangle, Aiming For Targets In The Range!Hello Traders Investors And Community, welcome to this important analysis about the current price-action situation within NFLX, it is clearly one of the profiteers of the corona-crisis as people staying at home in the lock-down and watching netflix-series. It is a good thing to relax especially in the current crisis where there is so much time left on the hand and nothing to do. So anyway this should not be a recommendation from my side but it is a growing economic field in the current crisis which shouldn't be ignored similar to the retail business like amazon or alibaba. On the technical side, I discovered some important bullish signs which made it clear that NFLX will develop some more moves to the upside, as it is at an all-time-high-level we are looking at the weekly perspective.
As you can see marked in my chart with the blue lines netflix just broke out a major ascending triangle which you can see marked with the blue lines in my chart. Netflix saw some good volume which confirmed the overall breakout and activated the target at the 580 level marked in green. This is the overall triangle target we have in the structure and it will also be the new all-time-high. To confirm it regularly we need to confirm the upper boundary of the ascending triangle, in this range we also have support from the 50-EMA, therefore, it is building a coherent bearish confluence-cluster in this range which you can see marked with the orange box in this level.
After the triangle target has been reached which is highly possible at the moment we need to see how NFLX develops further and if we can manage to climb above the triangle target and continue with its established uptrend. When we get some serious bearish pressure signs in that level it will be a interesting consideration to open up a short in this area otherwise the overall shape in trend is still in the direction upwards. The confirmation of the triangle can be used as a good conservative entry point to aim for the overall triangle target, otherwise the more conservative approach will be after we formed another high with good volatility after the triangle confirmed.
This price-movement in NFLX which we see here is anticyclical to the vast rest of the market because we established already an all-time-high in NFLX here. As I pointed out already in recent analysis there are gainers and losers in the current crisis and when considering something on the long-side we need to search to the truffles and hidden guesses we have in the market. It makes no sense to buy something which is cyclical with the market and don't profits from the current crisis like airlines which one of the smartest investors, warren buffet just sold recently. Therefore we should not fall for the illogical speculative approach like many people these days and look for stocks with a solid fundamental and technical base like NFLX in this case.
Thanks for watching everybody, support for more market insight and all the best!
Information provided is only educational and should not be used to take action in the markets.

NFLX AnalysisPrice did not play out as analyzed last week. Price is heading towards the fair value gap at 459.25 which I expected it to go over the past few weeks. Price also built up sell-side liquidity. I'm expecting the 50% FVG to be tapped before a dump.

$NFLX Breaking Daily Cloud & Gap FIllNASDAQ:NFLX breaking daily cloud and looking to fill the gap at $470

Netflix Weekly Support Convergence Test so far so goodHi guys. This is a MACRO Technical Analysis on Netflix (NFLX) on the 1 Week TImeframe.
This week we have TESTED Support on the 21 EMA and the Support trendline of the UPTREND channel.
Netflix is heavily supported not only by these 2 mentioned SUPPORT lines but also a 3rd Support, the black horizontal support line as well.
Everytime we've touched the Support line of the Channel, we've bounced to the Top of the Channel.
EXCEPT our most recent touch, that took us only half way before printing a Topping Tail Candle and selling off.
Watch how we close this weeks candle. If we close around or above $428.
That would be the best case scenario, as that would indicate an Engulfing Bullish Candle.
This could invalidate the Topping Tail Bearish Momentum.
BUT for now we need to watch what happens. Keep in mind that the Topping Tails can cause further price DECLINES.
AND we absolutely don't want a UPPER WICK for our current weekly candle. This would imply selling pressure and may indicate continuation of the TOPPING TAIL.
Watch also the VOLUME -> From here we should see increasing volume and or SPIKE in volume so price can continue up the channel.
For whatever reason if we BREAK DOWN from this SUPPORT CONVERGENCE area, the next level would be the 50 SMA.
Also NOTE, along with Topping Tail Candle, indicators are showing BEARish signs.
MACD has crossed BEARISH
RSI Broke BELOW Support Trendline.
For us to continue our UPTREND
MACD needs to CROSS BUllish and print green bars
RSI cannot print below the Horizontal Black line, as that would indicate a Lower low. And Ideally, get back above the Support Trendline and or continue UP.
__________________________________________________________________________________
Thank you for taking the time to read my analysis. Hope it helped keep you informed. Please do support my ideas by boosting, following me and commenting. Thanks again.
Stay tuned for more updates on NFLX in the near future.
If you have any questions, do reach out. Thank you again.
DISCLAIMER: This is not financial advice, i am not a financial advisor. The thoughts expressed in the posts are my opinion and for educational purposes. Do not use my ideas for the basis of your trading strategy, make sure to work out your own strategy and when trading always spend majority of your time on risk management strategy.

Netflix Identifies ResistanceWe have been watching this stock for a while during my weekly Livestreams (Fridays 4pm EST UTC-4). Last Friday, we noted that NASDAQ:NFLX has pulled back up to retest the 50% of the July Weekly Spike price action. This is happening following a long bullish recovery trend up to the MAJOR Weekly 50% Retracement Resistance of the November 2021-May 2022 bear trend.
The price action has defined itself clearly with the July high. The risk and wrong occurs with a breach of the July high. With this in mind we can define a high risk/reward trade to at least a 3 to 1 down to 257 and possibly beyond to retest the major low from 2022.
Implied Volatility is below average which is good for options. However, this is NOT a trade that can be effectively expressed with low duration expiries even though it might be tempting due to the high cost of the stock. To express this trade one must go well into 2024 expirations or short shares.

NFLX: Buy ideaBuy idea on NFLX as you see on the chart because we have the breakout with force the vwap indicator and the resistance line by a big green candle with a large green volume. Thanks!

Long on WMT 441 is a key lvl on WMT
If it continues going up, we could see a great movement to the upside
On the other hand, if it can't go up, it could make a pullback to 415 to continue in a RANGE
What do you think?


NFLX engaged in long short competition NFLX engaged in long short competition
This chart shows the weekly candle chart of Netflix stock in the past two years. The graph overlays the bottom to top golden section of May 2022. As shown in the figure, Netflix's stock hit the strong pressure of 3.618 positions at the bottom of the chart against the golden section in mid July this year, and then fell back. In the past six weeks, it has been engaged in long short competition between the 2.618 and 3.000 positions at the bottom of the chart against the golden section! For a period of time in the future, just use the 2.618 level of the golden section at the bottom of the graph to determine the strength of the Naifei stock's long short divide!

Play Netflix on the break of the VWAP lower or upper band .I've been playing VWAP breaks on the upper and lower band on Netflix it's expensive but position size up for the reversal it's not much of a reversal but when you position size up and you're guaranteed to turn this money there it's Bang Bang money if you don't have it at risk don't play. I always leave runners though cause you never know pledge your own risk this is not financial advice
