NVDA: Should I Pull The Trigger ?Stock analysis coming this week from various sources saying "Time to Pull The Trigger on NVDA" .. Is it ?
Let's take a quick look ..
- NVDA has recently formed the famous VCP (Volatility Contraction Pattern) - a good sign for a possible breakout soon
- but the VCP is forming below the 50SMA (blue) and 100SMA(gray) lines
- also there's a "supply pocket" (white rectangle) forming a resistance area at $115
- the good sign is, yesterday (on hype from GOOG and MSFT earnings, NVDA finally broke towards the 50SMA and looks like trying to get above) - first time since wk4 Feb
So when is the ideal entry? what do i need to see ?
=====================================
- Price needs to get above the 50SMA (blue Line) - Which will cause the MACD main line to get into positive zone
- 20SMA (purple line) gets above 50SMA (blue line)
- Ideally price breaks above the 2 pivot levels marked on the chart $115 and $123
- The US market needs to stabilize for all of this to happen :)
- Note: NVDA analysts (upside) price targets are between $160 (avg) to $236 (highest) - See NVDA forecast page in TV. So patience should be rewarded. Let's get to the safe zone first.
thoughts ?
NVD trade ideas

NVIDIA Massive bullish break-out after 4 months of selling.NVIDIA Corporation (NVDA) made a critical bullish break-out yesterday (in the aftermath of Meta's and Microsoft AI capex numbers) as it didn't just break above the 1D MA50 (blue trend-line) that has been intact as a Resistance since February 27 but also above the top of the Channel Down that has been the dominant pattern throughout this correction since the January 07 All Time High (ATH).
The 1D RSI is on an Inverse Head and Shoulders (IH&S) pattern, which is always bullish and if NVDA closes a 1D candle above the 1D MA50 next, then our short-term Target will be 143.50, which is just below Resistance 1 and the 2.0 Fibonacci extension.
-------------------------------------------------------------------------------
** Please LIKE 👍, FOLLOW ✅, SHARE 🙌 and COMMENT ✍ if you enjoy this idea! Also share your ideas and charts in the comments section below! This is best way to keep it relevant, support us, keep the content here free and allow the idea to reach as many people as possible. **
-------------------------------------------------------------------------------
💸💸💸💸💸💸
👇 👇 👇 👇 👇 👇

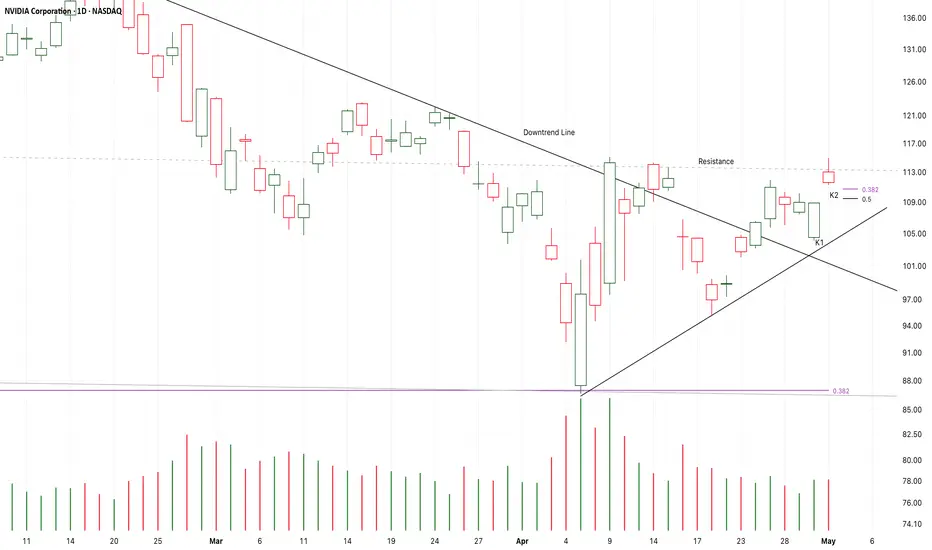
Chart Pattern Analysis Of NVDA
The recent several candles is a consolidation along the resistance.
And the supply pressure keeps at low level.
K1 is a bullish candle and it is also a potential right shoulder of a larger scale bullish head-shoulder pattern.
If the following candles close upon K2,
It is likely that another bull run will start here to test 125USD area.
On the other hand,
If K3 close below the bull gap at K2,
The risk will increase.
Long-110.5/Stop-109/Target-125
NVDA LTFLocal price action - the gap from 4/29 was filled in, but it left another gap on 4/30. During aftermarket hours, the price jumped up and approached the weekly level above but got rejected and finished the day red. We got a naked untapped pivot point below along with the range POC point of control.. not a bad week of price action.
From a range perspective price deviated to both sides and finisheded the day seemingly falling back into range. Let's see how the week ends.

NVDA Day Trade Plan for 04/29/2025NVDA Day Trade Plan for 04/29/2025
📈 111.90 109.90
📉 105.90 103.90
Thanks to all my followers! Truly appreciate the support!
Please like and share for more ES/NQ levels Tues & Thurs 🤓📈📉🎯💰
*These levels are derived from comprehensive backtesting and research and a quantitative system demonstrating high accuracy. This statistical foundation suggests that price movements are likely to exceed initial estimates.*

Nvda low time frameLocal price action - the gap from 4/29 was filled in, but another was left on 4/30. During aftermarket hours the price jumped up to approach the weekly level above and dropped back down. We got a naked untapped pivot point below along with the range POC point of control, not a bad week of price action.

How much money do I have? My real investment portfolioI’ve decided to start sharing my trades in a live-report format. What you see here is my actual portfolio — no fluff. Just the stock and crypto markets.
📊 Key Stats:
• 💰 Total across brokerage accounts: $22,167
• 📈 Profit since I started investing in 2020: $12,803
• ⚖️ Return: Around 60% total, with an average annual return of ~19%
📦 Portfolio Breakdown:
🧠 Top Performer — Nvidia
• Open positions: 6 shares
• Total profit including closed positions: $4,202
⚛️ Bet on Quantum Tech
• Holdings: QBTS and IONQ
• Long-term play with high potential
📈 Index Funds — Not a Priority
• Profit over 5 years: $523
• No open positions currently
🧨 Options — My Favourite Tool
• Total profit: $2,646
• Currently 2 open positions:
• NVDA 21NOV25 110P (sold put)
• AMD 21NOV25 80P (sold put)
If you would like to get nice overview in analytical platform drop a comment

What Is Dollar-Cost Averaging (DCA) in Investing and Trading?What Is Dollar-Cost Averaging (DCA) in Investing and Trading?
Dollar-cost averaging (DCA) is a popular strategy used by investors and traders to manage market fluctuations and build positions over time. Instead of trying to time the market, DCA focuses on consistent, regular investments regardless of price movements. This article answers “What is DCA?”, its advantages and limitations, and how it can be applied in both investing and trading.
What Is Dollar-Cost Averaging (DCA)?
So what is DCA investing? Dollar-cost averaging (DCA) is a strategy that involves consistently investing a fixed sum at regular intervals, regardless of the asset’s current price. This approach helps distribute the cost of purchases over time, potentially reducing the impact of short-term price fluctuations. Instead of trying to time the market perfectly—a challenging task even for experienced traders—a dollar-cost averaging strategy focuses on regular contributions to average the cost of assets.
This method offers a straightforward, disciplined strategy for both long-term investors and traders who wish to build or adjust positions gradually. By spreading out purchases, a DCA strategy may help mitigate the effects of market volatility. For example, during a period of market decline, the fixed investment buys more units at a lower cost, which could result in higher returns when prices recover. Conversely, during a sustained rise, the investor buys fewer units, which helps avoid overexposure. For example, if you invest $50 every week and the market is rising, you will buy fewer stocks, but when the market is moving down, you will buy more with the same amount.
What does DCA mean for market participants? DCA is particularly useful in uncertain economic environments where price swings are common. It provides a systematic approach to entering the market, removing the need to make snap decisions based on short-term market movements, and fostering a steady accumulation of assets over time.
How Does DCA Work?
DCA investing operates by establishing a regular schedule for investing a set amount of money into a chosen asset, regardless of its current market price. Instead of waiting for a particular price or market condition, funds are allocated at consistent intervals—be it weekly, monthly, or quarterly. Over time, this means buying more units when prices are lower and fewer units when prices are higher, resulting in an average purchase price that can be lower than if the investment was made in one lump sum.
Consider an investor using DCA. They commit £100 every month to buy company shares. In the first month, the share price is £20, so they purchase 5 shares. The next month, the price drops to £10, allowing them to buy 10 shares with the same £100. In the third month, the price rises to £25, and they purchase 4 shares.
Over three months, the investor has spent £300 and acquired 19 shares in total. To calculate the average cost per share, divide £300 by 19, which equals approximately £15.79 per share. This average is lower than the highest price paid and reflects the effect of buying more shares when prices are low and fewer when prices are high.
DCA also simplifies the process of entering the market. By adhering to a set timetable, investors bypass the need for constant market analysis, making it particularly appealing for those who prefer a more hands-off strategy. This systematic approach can be applied not only to traditional investments like shares and funds but also to other assets that traders and investors engage with.
DCA in Trading
DCA isn't just for long-term investors; traders can also employ it to navigate the ups and downs of fast-moving markets. By spreading out their entries or exits, traders may potentially lower the average cost of a position or build on a winning trend, all while managing their exposure to volatile moves.
Lowering the Average Price
For traders facing a position that's moving against them, DCA offers a way to adjust the average entry cost. By allocating additional funds, the average price of the position may be reduced. This approach can create a potential opportunity to exit with better returns if the market reverses. However, it is important to note that this method also increases exposure, and additional entities might compound losses if the trend continues.
Adding to a Winner
Conversely, traders may apply DCA to increase their positions when an asset shows strength. By gradually adding to an effective trade, the overall exposure is built in a controlled manner, potentially capturing further movement without committing all capital at once. This method is particularly popular in markets where momentum builds slowly, allowing traders to gradually take advantage of the sustained trend.
Applications Across Markets
Using DCA in stocks can help manage entries during periods of volatility, especially when market sentiment shifts rapidly. Forex traders often use similar techniques to adjust positions in response to fluctuating currency pairs, while the high volatility seen in crypto* markets makes DCA an appealing strategy for building positions gradually.
When using DCA in trading, a disciplined approach is essential. Whether lowering the average cost in a losing position or building on an effective trade, traders should carefully consider the additional risk that comes with increased exposure.
Advantages of Dollar-Cost Averaging
Dollar-cost averaging offers a range of advantages that make it an attractive strategy for both investors and traders, especially when navigating uncertain markets.
Mitigating Market Volatility
By investing a fixed amount at regular intervals, DCA spreads out exposure over time. This approach can reduce the impact of sudden market swings. Instead of being affected by a one-off high price, the average cost is spread across different market conditions. This may help stabilise entry points and smooth out short-term volatility.
Disciplined Investment Approach
DCA promotes a structured investment routine. With regular contributions, there is less temptation to try timing the market. This disciplined approach might be particularly useful when markets are highly volatile or ahead of news and economic events. It encourages systematic investing, reducing the likelihood of making impulsive decisions driven by market noise.
Accessibility for All Traders
DCA does not require intricate market analysis or deep expertise in market timing. Its straightforward nature makes it appealing to both newcomers and seasoned traders looking for a simpler method to build positions over time. By providing a clear framework, DCA allows traders to focus on long-term goals without the pressure of constant market monitoring.
Limitations of Dollar-Cost Averaging
While dollar-cost averaging offers a structured approach to investing and trading, there are some limitations to consider.
Potential Opportunity Cost
Spreading out investments means funds are gradually deployed over time. In a market that is consistent, waiting to invest might lead to missed returns compared to committing all funds upfront. This method can reduce the impact of volatility but might underperform during extended trends.
Continued Exposure to Market Trends
Investors remain exposed to the market throughout the investment period. If the market experiences a prolonged trend, regular investments will accumulate at better prices, but overall returns may still suffer. This approach does not eliminate market risk and requires a long-term perspective to potentially see a turnaround.
Dependence on Consistency
The effectiveness of dollar-cost averaging relies heavily on maintaining a consistent investment schedule. Any interruption or inconsistency can dilute the intended advantages of the strategy. It also assumes that investors are able to commit regular funds, which may not be feasible in all financial situations.
Comparing DCA to Lump-Sum Investing
Comparing DCA to lump-sum investing offers insights into different approaches to managing market exposure and returns.
Risk Exposure
Lump-sum investing involves placing all available funds into an asset at once. This method can yield higher returns if the market moves in their favour, but it also exposes the investor to immediate risk if the market moves against them. In contrast, risk is spread over time through a dollar-cost average, meaning regular investments reduce the likelihood of entering the market at a high point and potentially lowering the overall average cost.
Market Conditions
The performance of each approach can vary depending on market trends. In steady trends, lump-sum investing may capture more returns since all funds are deployed early. However, in volatile or declining conditions, DCA could mitigate the effects of short-term fluctuations by smoothing out entry prices over time.
Flexibility and Commitment
Lump-sum investing requires confidence and a readiness to commit all funds immediately. DCA, on the other hand, offers a more measured entry into the market. This method is popular among those who prefer a systematic approach and might not have a large sum available at one time.
The Bottom Line
Understanding the dollar-cost averaging definition can help investors and traders potentially manage market volatility and reduce emotional decision-making. While it has its limitations, DCA can be an effective strategy for building positions over time.
FAQ
What Is an Example of Dollar-Cost Averaging?
Imagine investing £100 into a stock every month, regardless of its price. In January, the stock costs £20, so you buy five shares. In February, the price drops to £10, allowing you to buy 10 shares. In March, the price rises to £25, and you buy four shares. Over three months, you’ve invested £300 and purchased 19 shares, averaging out your cost per share to £15.79.
Is There the Best Dollar-Cost Averaging Strategy?
The most effective DCA strategy depends on individual goals. A consistent, long-term approach with regular investments—whether weekly or monthly—may help smooth out market volatility. Focusing on diversified assets could also reduce risk exposure.
What Is the Daily DCA Strategy?
This strategy involves investing a fixed amount every day through DCA, meaning it may help minimise the impact of short-term price fluctuations in volatile markets. However, it requires careful planning due to frequent transactions and potential fees.
Does Dollar-Cost Averaging Work With Stocks?
Yes, DCA is commonly used with stocks. It may help manage the effects of market volatility, allowing investors to build positions over time without worrying about short-term price swings.
What Does DCA Mean in Stocks?
DCA, or dollar-cost averaging, in stocks, means regularly investing a fixed amount, regardless of price, to average out the cost per share over time and manage market volatility. A similar answer is true for “What does DCA mean in crypto*?”, except it would involve a regular fixed investment in a particular cryptocurrency*.
How to Calculate DCA in Crypto* Investing?
There is a simple formula to calculate DCA, meaning in crypto*, an investor would just divide the total amount invested by the total number of units purchased. This provides the average cost per unit over time, regardless of price fluctuations.
*Important: At FXOpen UK, Cryptocurrency trading via CFDs is only available to our Professional clients. They are not available for trading by Retail clients. To find out more information about how this may affect you, please get in touch with our team.
This article represents the opinion of the Companies operating under the FXOpen brand only. It is not to be construed as an offer, solicitation, or recommendation with respect to products and services provided by the Companies operating under the FXOpen brand, nor is it to be considered financial advice.

NVDA Rallying After Trump Roundtable – Will the Momentum Hold? 💥Today’s rally in NASDAQ:NVDA got a little extra fuel after CEO Jensen Huang spoke at Trump’s investor roundtable. From what I’m seeing on the chart, the market liked it—at least in the short term.
Let me walk you through what I’m thinking as I line up the Daily vs. 1H timeframes and weigh that against options sentiment from the GEX chart.
🕰 Daily Chart View:
Price is trying to recover inside a downtrend channel, and today’s candle is testing the breakdown zone around $110–113. Momentum is definitely building, with MACD ticking higher and Stoch RSI pushing into bullish territory. But... we’re still technically below a key breakdown trendline (starting from the $150+ level), so bulls need continuation soon or it risks another fade.
⏱ 1H Chart Analysis:
The 1-hour chart looks a lot more bullish than the daily. After breaking through $107, NVDA exploded through key levels and is now pressing against $113.96 (GEX Gamma Wall) below. That’s also the highest net positive GEX level, so we could be entering a zone of dealer hedging that resists more upside unless flows get really aggressive.
You’ll also notice IVX is elevated (58.2), IVR is low (34.8), and GEX is neutral to slightly green. There’s a CALL-heavy structure forming up to $115, with the market currently coiling beneath it.
🔁 My Thought Process:
I think the CEO's participation in the Trump investor meeting gave institutions some reassurance, and that may explain the sharp bounce from $107. However, unless we can hold above $114 and squeeze into $115–$117, I see this as more of a trader’s move than a longer-term breakout just yet.
🎯 Trade Setup Idea:
* For Calls: Wait for a clean break above $114 → potential target zone: $117–120. Stops below $110.
* For Puts: If price fails again near $113.50–114 and we see weakness into the afternoon, watch for $110 → $107 retrace.
* Neutral: If we chop under the Gamma Wall and IV remains high, premiums may decay fast — sit out unless a clean direction emerges.
🧠 Final Thoughts:
I’ll stay flexible. GEX shows us $113.96 is the tug-of-war zone right now, and if bulls can reclaim and hold above it with volume, we could shift toward a gamma squeeze. But I’m also aware it might be a fade if the momentum stalls now that the Trump headline is digested.
Disclaimer: This post is for educational purposes only and not financial advice. Always do your own research and manage your risk.

NVDA - BullishForecast a break-out up as the price increased by 3.3% in the after hours.
- The price area in a falling wedge, almost a descending channel.
- The MACD indicator in the Weekly frame shows an uptrend after a rare day of oversold (04.04.2025).
The price today (04.30.2025): $108.92.
Price target: $135.00.
Stop loss: $95.00.
IMO, amateur trader.

-14% 95 incomingBack down to retest the lows snagged 100 95 90 5/23 P before the close today then SMCI drops it 2% with a BILLION dollar miss not the news I was anticipating but I'll take it very fragile stock not holding up well GDP tm could accelerate loss.

NVIDIA: Don't turn your back on the A.I. darling yet.NVIDIA has turned neutral on its 1D technical outlook (RSI = 48.902, MACD = -2.040, ADX = 28.815) as it has recovered a portion of the 2 month correction. April's low was exactly on the 1W MA100 just like the Low of the 2024 consolidation phase has been near the 1W MA50. The pattern is recurring and the rallies naturally get weaker each time as we approach the end of the Cycle this year. The 1st rally was +358%, the 2nd +257% so the 3rd one now is expected to be +157%. That gives a $225 target. The next Top will most likely start a new correction (Bear Cycle) for a 3rd Bottom on the 1W MA200.
## If you like our free content follow our profile to get more daily ideas. ##
## Comments and likes are greatly appreciated. ##

Looking for 50month MA Retest for NVDA NASDAQ:NVDA
Cyclical pullbacks usually see this stock pullback to the 50month moving average, that is currently sitting at $53

Reacting to OBnvda is a must-have in your portfolio. Parabolic run for long term, as AI narrative will be outperforming the next 10 years.

NVDA – Losing Steam After Hitting ResistanceNVDA had been steadily climbing in a rising channel for the past few days, bouncing neatly off that lower trendline and giving bulls a reason to stay engaged. But today it finally lost that trendline — and to me, that’s a subtle but important shift in control. Buyers didn’t defend like they had before.
The rejection from the $111–$112 zone wasn’t random either. That area has been a sticky level on the daily chart — a prior swing high and also where a heavy Gamma Call Wall sits based on options data. Price tapped it, hesitated, and rolled over. Now with this break of structure on the 1-hour timeframe, I’m starting to lean cautious.
Momentum is fading. MACD is curling down and looks ready to cross bearish. Stoch RSI is already bottomed out, but there’s no bounce signal yet — just drifting in oversold. It feels like bulls are waiting, but not stepping in aggressively anymore.
On the daily chart, this entire push still looks like a lower high within a broader downtrend. And with price now back near $106.70, it’s hanging just above that key $105 level — which is not only a horizontal support zone but also lines up with a High Volume Level and a major GEX magnet. If that breaks, I wouldn’t be surprised to see price gravitate toward $102 or even the $100 level where the Put Wall sits heavy.
🔧 Trade Setup Ideas
* Short Bias below $108: If NVDA stays below the broken channel, I’m leaning bearish. A clean rejection near $108–$109 offers a good risk/reward for short entries.
* Target: $105 first, then $102. Stop above $109.50.
* Long only if price reclaims the trendline and closes above $111 with volume. That would negate the breakdown and could signal a squeeze back toward $115.
🧠 Options Perspective (GEX-Informed)
* Put Play Idea: Buying a $105 Put for May 3rd expiry (0–3 DTE) could work if price flushes below $106.70. IV is still elevated, but the IV crush risk is smaller on directional moves.
* Gamma Roadmap:
* $105 = High Volume Node + HVL
* $102 = Strong Put Wall (7.5% GEX support)
* $100 = Final magnet if things really unwind
* Call Side Risk: Unless NVDA cleanly reclaims $111, calls above that level are a trap. A bounce back to $110 would be a fade zone unless momentum shifts.
So in short — the trendline broke, bulls are on their heels, and $105 is the level to watch. Until something changes, I’m favoring downside plays but being patient for cleaner setups.
Not advice — just sharing my thinking as I trade what I see.

CORRECTED. NVDA HEADING INTO MAY 25'Still Bearish.
Clear top and been working down ever since
Yet another reject near the .382 FIB LEVEL, which was a reload zone in Q3 and Q4 of 2024.. now a sell zone since Q2 25' began as its cooled off from ATH to end 24 and begin 25.
Looking to buy @ .236 & lower.
Would not take a BUY higher until a break & hold above .5 to confirm some strength to an upside move.
NVDA overall as a company is going to be a powerhouse in multiple spaces in the future, we can all see that. It's not going anywhere and has multiple huge investments to push its industry hold even higher and revenue down the line to increase.
Their wide range of partnerships within the autonomous driving space with companies like GM, Toyota, TSLA (for its chips) and more position NVDA to be one of, if the not THE the largest market cap companies within the next 10 years to me.
Autonomous driving I personally feel will begin to make its way to a MAINSTREAM space beginning around 2030 and by 2030 will have an extreme space in day to day by 2035.
Long term vision beats short term gain!

NVDA Heading into March 25'Still Bearish.
Clear top and been working down ever since
Yet another reject near the .382 FIB LEVEL, which was a reload zone in Q3 and Q4 of 2024.. now a sell zone since Q2 25' began as its cooled off from ATH to end 24 and begin 25.
Looking to buy @ .236 & lower.
Would not take a BUY higher until a break & hold above .5 to confirm some strength to an upside move.
NVDA overall as a company is going to be a powerhouse in multiple spaces in the future, we can all see that. It's not going anywhere and has multiple huge investments to push its industry hold even higher and revenue down the line to increase.
Their wide range of partnerships within the autonomous driving space with companies like GM, Toyota, TSLA (for its chips) and more position NVDA to be one of, if the not THE the largest market cap companies within the next 10 years to me.
Autonomous driving I personally feel will begin to make its way to a MAINSTREAM space beginning around 2030 and by 2030 will have an extreme space in day to day by 2035.
Long term vision beats short term gain!

HOW-TO: Use the Camarilla Pivots & BBT Strategies indicatorThis how-to shows the Camarilla Pivot & BBT Strategies indicator in action, the 5-minute timeframe is ideal for this. It shows the price action reacting to the HA play (S3 to R3 traversal). The "H" means that the ticker is in a Higher range on this day, the "A" refers to the label on the strategy in the image. In fact, the price does past R3 (which is the exit point) and reaches R4, at which point it trigger the "E" play, which is an R4 extreme reversal. A great trade, if you took it!

NVDA longNASDAQ:NVDA has borken out of its channel and is pushing up, forming a dubble bottom. NASDAQ:NVDA is looking very bullish based on TA rnight now.

NVIDIANVIDIA Corp engages in the design and manufacture of computer graphics processors, chipsets, and related multimedia software. It operates through the following segments: Graphics Processing Unit (GPU), Tegra Processor, and All Other. The GPU segment comprises of product brands, which aims specialized markets including GeForce for gamers; Quadro for designers; Tesla and DGX for AI data scientists and big data researchers; and GRID for cloud-based visual computing users. The Tegra Processor segment integrates an entire computer onto a single chip, and incorporates GPUs and multi-core CPUs to drive supercomputing for autonomous robots, drones, and cars, as well as for consoles and mobile gaming and entertainment devices. The All Other segment refers to the stock-based compensation expense, corporate infrastructure and support costs, acquisition-related costs, legal settlement costs, and other non-recurring charges. The company was founded by Jen Hsun Huang, Chris A. Malachowsky, and Curtis R. Priem in January 1993 and is headquartered in Santa Clara, CA.

Bad News from NVDA and ASML Put Pressure on AI StocksTwo pieces of bad news hit the chip sector in a single day.
First, the U.S. announced new restrictions on Nvidia, blocking the sale of its H20 chip to China. H20 was the only AI chip Nvidia could legally sell to China under existing regulations. The company stated the new restrictions could cost up to $5.5 billion.
The second blow came from ASML’s earnings report. ASML is the sole producer of EUV machines, which are critical for manufacturing advanced chips, including those used in AI. ASML's revenue miss, combined with the Nvidia news, weighed heavily on technology stocks. However, there is a silver lining: the revenue miss was due to weaker DUV machine sales, which are used for more basic chips. EUV sales actually beat market expectations by 33.54%, indicating that investment in AI infrastructure remains strong.
Nvidia shares are down more than 6% in premarket trading. This downward pressure may continue after the market opens. If the price drops below 100, it could present a buying opportunity for medium- to long-term investors. AI investment continues globally, and countries outside the U.S. are likely to accelerate their efforts to catch up. Despite the recent negative sentiment, there is no major change in the long-term outlook for the sector.

NVIDIA Chart with Advance Smart TP, SL, and EMA Trailing"Technical Analysis of This New Chart (NVIDIA 15-min, Heikin Ashi)
Setup:
Entry: 105.23
Forecast EMA: 103.02 (trending nicely upwards under the price = bullish support)
🧠 Key Observations:
The Forecast EMA result varies based on your settings and the selected chart timeframe."
Stop Loss: 99.97 (tight but safe under previous consolidation zone)
Take Profits:
TP1: 110.50 ✅
TP2: 115.76 ✅
TP3: 121.02 ✅
🧠 Key Observations:
Strong Breakout: You caught the move perfectly after a big consolidation phase (accumulation area visible).
Healthy Pullback: Small pullback after TP2 — healthy behavior, not a sharp reversal yet.
Forecast EMA Position: Price is well above Forecast EMA (103.02), and EMA is rising ➔ very bullish.
🛡️ Upgraded Trade Management Plan (for this chart):
1. If still holding the trade:
✅ Stop Loss Adjustment:
Now that TP1 (110.50) was hit, you should move Stop Loss up to your Entry (105.23) ➔ You are now risk-free.
2. Partial Take Profits Plan:
🎯 At TP2 (115.76):
➔ Sell 50% of remaining position.
➔ Activate a trailing stop for the rest.
🎯 At TP3 (121.02):
➔ Let the trailing stop follow.
➔ Tighten the trail after every new 15-min high is broken.
3. Trailing Stop Strategy After TP2:
📈 Trail the stop 2 bars behind the most recent swing low on the 15-min chart.
Example: If a candle makes a higher high and a higher low ➔ move stop 2 candles back to protect gains.
✍️ Special Notes:
If price suddenly drops and closes a full 15-min candle below Forecast EMA (103.02), it’s a sign momentum is weakening — you may want to close manually if that happens instead of risking trailing stop whipsaws.
Heikin Ashi candles make it easier to spot strong trends — watch for small-bodied candles (like dojis) at TP2/TP3 ➔ potential reversal signals.

NVDA walkthrough. NDOG+SMT Divergence. Intermarket CorrelationNASDAQ:NVDA
Pairing the NVDA and NQ to understand the direction of the expansion. Although IOF is enough with ES. But if you want to trade the stocks primarily you can use this
