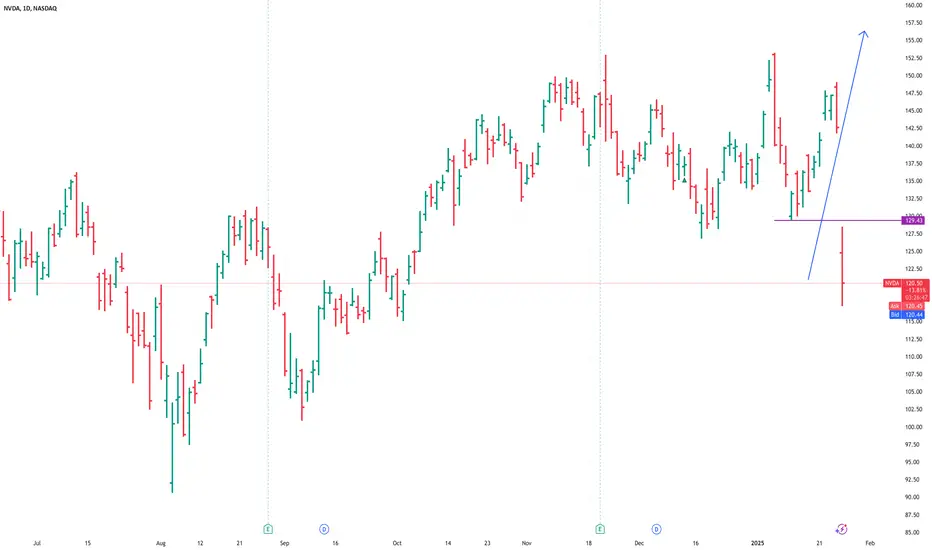
$NVDA.... "Buy the Dip" Value AreasWith the release of DeepSeek, it sent NASDAQ:NVDA tumbling 20%. If this continues over the coming weeks/months, here are some value areas to "buy the dip" if you're looking to get in.
NVD trade ideas

Nvidia Shares Plunge More Than 17% Nvidia’s stock has experienced a significant drop in price in recent hours due to growing concerns about new competition from China, represented by the startup DeepSeek. This Asian startup is positioning itself to offer services similar to those of current AI industry leaders but at a much lower cost. Additionally, its open-source model, unlike competitors such as OpenAI , has generated high expectations, marking a new competitive challenge from China to the U.S. in this sector. Nvidia has led the steep declines in the tech sector in the short term.
Range Breakout:
Recent selling pressure has caused a breakout from a consistent lateral range that had been in place since late October 2024. The movement has been so aggressive that the price has also broken below the 100-period moving average and is now struggling with the 200-period moving average. If the strong bearish pressure continues in the coming sessions, it could jeopardize the long-standing upward trend visible on the daily chart prior to this event.
RSI:
The RSI indicator line has quickly adopted a bearish slope, moving decisively away from the neutral level of 50. However, recent price action has brought the line closer to the oversold zone at 30 , suggesting that the momentum of the current decline is significantly imbalanced. This could pave the way for small upward corrections in the short term.
Key Levels:
$114: Current support level corresponding to neutral zones from August and September 2024. Bearish oscillations breaking below this level could strengthen selling pressure and establish a sustained bearish bias in the market. However, this zone could also trigger new upward corrections in the coming sessions.
$131: The nearest resistance level, coinciding with the 100-period moving average. Oscillations near this level could restore market neutrality and potentially lead to a new lateral channel.
$144 : Distant resistance level. Oscillations reaching this level again would bring the strong long-term bullish trend back into focus.
By Julian Pineda, CFA - Market Analyst

NVDA LESSON Now We Hunt For A DISCOUNT Nvidia⚪️ NVDA Another example of traders getting
trapped at the high.
⚪️ Also a prime example of traders
entering pre 150 break.
We don't need level 2 data to know
how HUMANS WILL ACT.
HUMAN BEHAVIOUR IS PREDICTABLE.
✅️That is an edge we can use too................
🟢 Every trend starts with a breakout and yes if you take everyone you will never miss the NEXT BIG MOVE BUT.....
🟢 By doing so you will inevitabley give up a high win rate, and the fact is that most humans would rather be RIGHT than make MONEY.
⭐️THAT IS JUST SIMPLE HUMAN BEHAVIOUR.⭐️ IT'S STRANGE BUT TRUE⭐️
🌎Most traders would rather sacrifice more profit for a HIGHER WIN RATE🌍
Some of the most PROFITABLE TRADERS & INVESTORS in the WORLD have a WIN RATE BELOW 50%.❕️
❗️LET THAT SINK IT...❗️
⚠️ 🟢SeekingPips🟢 SAYS SAVE THIS GOLD LESSON NOW YOU CAN THANK ME LATER⚠️

NVDA closes below 200 Day SMANASDAQ:NVDA had a very bad day today with more than 550 billion $ Market Cap destroyed. This is one of the worst days for NVDA since March 2020. The 200 Da SMA price was 122 $. NVDA closed @ 118 $. This makes it a daily close below the 200 Day SMA. There might be some more downside and sideways movement before it starts a bullish upward trend before its earnings release on Feb 26. 6-12 Months down the line this might be one of the best buying opportunities. Long NVDA 110 $ - 120 $.

Buy the 18% Panic Dip!Analysts are targeting 180$ Average for NVIDA's price target. With the new 50 series GPUs being released and being sold out, NVIDIA still has room to grow despite all this growth. Seize the opportunity. The company is still fundamentally sound according to ZenRating and a1tradings stockbox. It is the top holding in hedge fund portfolios and in the S&P. This scare will turn around. It is inevitable.

NVIDIA's Record Drop: Live with TradeStation (TradingView Show)Join us once again LIVE with David Russell, Head of Market Strategy at TradeStation, as we dive into the stock market sell-off and what it means for your portfolio heading into February 2025. With heightened volatility, NVIDIA taking a hit, and AI-driven tools like DeepSeek offering new market analysis, it’s key to understand how to navigate the current turbulence. As January winds down, we’ll discuss strategies to stay ahead, leverage relative strength, and position for long-term success despite the ongoing downturn.
Here’s a sneak peek of what we’ll cover:
1. NVIDIA’s recent drop is tied to DeepSeek’s shift in AI pricing, raising concerns about future profitability. Investors are still assessing how this will affect NVIDIA’s growth trajectory.
2. While attention is on volatility, some stocks have quietly hit all-time highs, revealing hidden strength in overlooked sectors. These gains suggest opportunities many may be missing.
3. Emerging strength is especially evident in sectors like communications and certain industrials, with companies showing resilience and strong earnings. These sectors could offer solid value plays for those willing to look beyond the obvious.
4. Traders heading into 2025 should focus on managing risk and staying nimble, especially with potential rate hikes and geopolitical risks on the horizon. Flexibility and discipline will be essential.
5. As the Fed meeting and GDP report approach, the market is primed for volatility. These key releases could signal shifts in monetary policy or economic conditions, making it vital to stay informed and adjust your positions accordingly.
Don’t miss this session for actionable insights on how to navigate this market turbulence and set yourself up for success in 2025.
This show is sponsored by TradeStation. TradeStation pursues a singular vision to offer the ultimate online trading platform and services for self-directed traders and investors across the equities, equity index options, futures, and futures options markets. Equities, equities options, and commodity futures products and services are offered by TradeStation Securities Inc., member NYSE, FINRA, CME, and SIPC.
See below:
www.tradestation.com
www.tradestation.com

NVIDIADeepSeek's emergence as a potential challenger to US AI companies is expected to significantly impact the US tech market. With its breakthrough models offering performance comparable to leading offerings at a fraction of the cost, DeepSeek may "puncture some of the capex euphoria" surrounding major US tech companies like Meta and Microsoft

Why I Believe NVIDIA (NVDA) Is Oversold and Ready to BounceI’ve been following NVIDIA (NVDA) closely, and while I’m aware of the recent negative news, I believe the market’s reaction has been completely overblown. To me, this pullback has pushed NVDA into oversold territory—not because of technical indicators like RSI (which I’m not relying on), but because the price is now sitting at a strong demand level that historically has seen solid buying interest.
In my opinion, the market has overpriced the impact of the news. NVIDIA’s fundamentals remain strong, and I don’t see anything here that fundamentally changes the long-term story of the company. This feels more like a short-term overreaction that’s created an opportunity to get in at a discount.

DeepSeek: Is the $2 trillion panic justified? A small Chinese AI startup, DeepSeek, is responsible for erasing $2 trillion from the US equity market, within 12 hours.
Nvidia's stock is down ~17% at the time of writing, while shares of other US-based AI-related companies, including Oracle, Broadcom, and AMD, have fallen between 12% and 20%. Microsoft, a major investor in OpenAI, has also dropped more than 3%. However, Apple stock has gained, with the market seemingly dismissive of its Apple Intelligence product.
DeepSeek launched a free, open-source large language model in December, reportedly developed in just two months for under $6 million. This news and its implications are only just filtering into mainstream market consciousness now following the release of DeepSeek's chatbot app.
Investors are now questioning why US firms are spending hundreds of billions on Nvidia chips when a startup claims to achieve significant results at a fraction of the cost and raised concerns about the US losing its perceived dominance in the AI sector.
However, industry figures, including Elon Musk and Scale AI CEO Alexandr Wang, are scrambling to change the narrative though. Some suggest that DeepSeek likely has access to 50,000 NVIDIA Hopper GPUs—despite their claims of using just 10,000 A100 GPUs—due to U.S. export restrictions.

NVIDIA Wave Analysis 27 January 2025
- NVIDIA broke support zone
- Likely to fall to support level 115.00
NVIDIA opened today with the sharp downward gap breaking the support zone located between the support level 126.65 (former monthly low from December) and the 38.2% Fibonacci correction of the upward impulse from August.
The breakout of this support zone accelerated the active short-term impulse wave i, which belongs to the intermediate impulse wave (3) from November.
NVIDIA can be expected to fall further to the next support level 115.00 (former monthly low from October).

Prediction Jan-Mid FebI've been totally wrong with dates, but my price points have been there the past month.
I don't use Fib., only EMA, MFI, CMF, MACD and chart analysis
Prediction: Something is going to happen news-wise around Jan (The time someone is coming into office...) which will correct Nvidia and SPY (SPY is due for a 5-10% correction, historically and for continuing bullish health.
What do you guys think?

NVDA ... New Nvidia analysis with linesJust a few ideas for line based on past trends and support structure connections.
Not one to care where this goes, but use your own indicators to see which of these lines seem most important to you.
10 min:
30 min:

i dont know guys!I don’t know, guys, but I think this stock is getting interesting. Just last Friday, the first fractal of the drop formed, and now we’ll see the continuation. All this activity is happening within a megaphone pattern, which makes me think NVDA’s price will surpass its all-time high. The optimization of LLM models doesn’t affect anything negatively—it only helps them become more popular and drives more chip sales.
We’re on the brink of launching the Stargate project, and let’s not overlook the fact that both the hardware and software used for AI are evolving. Nothing is set in stone, which is why sales will continue to be monumental. A clear example is that if these models become optimized enough, we could see the massive use of new, more compact chips for household and personal appliances, robots, etc. So don’t be afraid—join the revolution!

NVIDIA: Crashed on the 1D MA200 after 2 years. Last stand.NVIDIA is approaching oversold valuations on its 1D technical outlook (RSI = 35.351, MACD = -0.820, ADX = 27.301) following the DeepSeek news and breached its 1D MA200 for the first time in 2 years. It was January 13th 2023 when we last saw the price trading on this trendline. The 1W MA50 is just a click under and there is no other way to put it than this being NVDA's last hold. The stock is at -23% from its ATH and the pattern that has to hold in order to provide an immediate rebound is the Megaphone whose LL trendline we just hit today. As long as this holds and the 1D RSI starts reversing near the oversold level, NVIDIA should technically test the 153.00 Resistance in a month or so. Failure to hold this pattern and a weekly candle closing under the 1W MA50, may result in a bubble burst and test of the 101.50 and 91.50 support levels.
## If you like our free content follow our profile to get more daily ideas. ##
## Comments and likes are greatly appreciated. ##

$NVDA, Long, TP>25%NASDAQ:NVDA , Long, TP>25%
Fundamentally the stock is good.
Choose an entry point and do not forget about a protective order if you are trading with leverage.
Don't risk it if you're not sure.
Good luck to everyone.

NVDA long-term three wavesJust to mark it as a reminder to myself that the cycle could be very long and don't buy until it touches the proper level

Where to catch the falling knife?So it's dropped a fair bit since I started writing this post, but needless to say, it would be best to wait and see something technical before a reasonable buy on a pull back could be justified. Looking at the weekly time frame, I'd expect a bounce from about the 115 level, so any bounce could then be judged on its own merits, if it's technical and showing signs of resuming back to the upside, then better to buy on a pull back from there (similar to the GBP chart), in what would be a lower time frame wave 2, than when it could just as easily keep dropping.

NVDA HEAD N SHOULDERS TOP .nvda is a perfect candidate for a big short on NVDA, bc is forming an h&s top, RSI divergence, low volume, nosense price action up, is overbought.
short n buy with the intraline support.

Disengage from the herd, Markets are not Rational places!“The prevailing wisdom is that markets are always right. I take the opposition position. I assume that markets are always wrong. Even if my assumption is occasionally wrong, I use it as a working hypothesis. It does not follow that one should always go against the prevailing trend. On the contrary, most of the time the trend prevails; only occasionally are the errors corrected. It is only on those occasions that one should go against the trend. This line of reasoning leads me to look for the flaw in every investment thesis. ... I am ahead of the curve. I watch out for telltale signs that a trend may be exhausted. Then I disengage from the herd and look for a different investment thesis. Or, if I think the trend has been carried to excess, I may probe going against it. Most of the time we are punished if we go against the trend. Only at an inflection point are we rewarded.”
― George Soros, Soros on Soros: Staying Ahead of the Curve
Most people ask themselves why NVDA should lose 15% of its market cap on the news about a Chinese company that claims to have outperformed ChatGPT by spending 5.5 million USD on training their models.
I do not care about if the claim is true or not, because I am confident ChatGPT was very hyped, and today the bubble burst.
No matter how much everyone in the AI industry and GPU makers trying we will not gain back the trust of people who see their capital melting in front of their eyes!


NVDA - Sellside Liquidity Run to Long ITM Calls >7 Days outI'm already long NVDA in a net profitable hedged position. I went long at 129 and overhedged at 151. The CES event stank of buy the rumor, sell the news. The chart structure also supported a clear buyside liquidity run to that level.
The double wicks at the top of the range indicate an intent to run through buyside again. Before the CES run, a gaping block shaped void near ATH was clearly visible. This was a bearish selling block that has since been filled. That seller had to be bought out before NVDA could continue its run.
There has been evident presence of sellside liquidity at ~129 since the beginning of the run. Initially I believed that would get run out before the buyside run, but I was wrong. Given the state of the VIX, TSLA, Silver, and Long term bond yields, a volatility spike capable of driving any weak hands (i.e. unhedged) out of NVDA feels imminent. I made a few mistakes on this run and my current NVDA position, though profitable and riskless is still at risk of being called away (at a profit).
None the less, I intend to add onto my position if a volatility spike and liquidity run does occur and fix my risk using shorter dated ITM calls. A volatility expansion of this magnitude has the ability to run out even very conservatively placed stops, so ITM calls are the best bet I have to enter into a risk managed position.
A large scale volatility bid will very quickly get sold by volatility sellers and traders (like myself) who mop up the blood in the streets. My short volatility positions are already hidden liquidity on the books.

LONG $NVDA PRE-MARKET; AT 150 EMA..This is a daily chart with a 150EMA. Lots of fear overnight. ChineseAI. Adding to my NVDA pre-market. 150EMA is a key level for price to test. To me it's a high-probability opportunity to add. Best of luck everyone.
