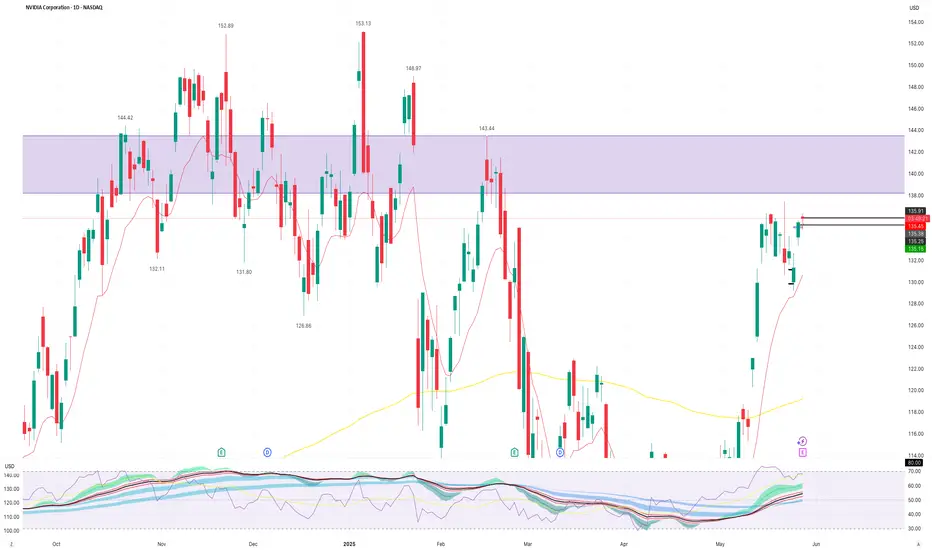
NVIDIA Massive Cup and Handle targets $200.NVIDIA Corporation (NVDA) is pulling back aggressively following yet another positive Earnings report, where they beat the estimates again but the market is reacting with selling. That has been a 'norm' in the past 12 months but even from a technical standpoint, the price reached the 143.60 Resistance level (made of the February 18 High), so profit taking is technically normal market behavior here.
On the longer term however, this Resistance test potentially forms the top f a very powerful pattern, the Cup and Handle (C&H). At the moment, the market has the support of both the 1D MA200 (orange trend-line) and 1D MA50 (blue trend-line) and the Handle, which has just started, has some room to safely consolidate for a while before the pattern break-out upwards.
Technically, C&H patterns reach their 2.0 Fibonacci extensions after the break-out, so our medium-term Target is set at $200.
Notice also the Bearish Divergence on the 1D RSI, which is similar to that of late October 2024. A break below the 1D MA50 risks the bullish structure on this pattern.
-------------------------------------------------------------------------------
** Please LIKE 👍, FOLLOW ✅, SHARE 🙌 and COMMENT ✍ if you enjoy this idea! Also share your ideas and charts in the comments section below! This is best way to keep it relevant, support us, keep the content here free and allow the idea to reach as many people as possible. **
-------------------------------------------------------------------------------
💸💸💸💸💸💸
👇 👇 👇 👇 👇 👇
NVD trade ideas

NVDA 4 HR. WAVE 5 IS LIKELY OVER & DROPPING ON CORRECTION!1). Price is very likely heading towards the fair Market value @ 123. 2). Risk Assets are weak today on US$ strength! 3). BANKS ARE SELLING! 4). Volume is dropping. 5). Trendline intersecting with target fib. level 100% & PRICE 123.

NVDA looks weak AGAIN5/30 Market news is breaking and not good re Tariffs with China.
NVDA now has much more competition for its product AND in the stock market.
Watching for consolidation in range.
Nvidia Posts Another Blowout Quarter. What Can Slow It Down?Hint: Not much.
🚀 Earnings So Good You Can’t Ignore ‘Em
Another quarter, another jaw-dropper from Nvidia NVDA . In what has basically become a quarterly ritual at this point (congrats to all who celebrate!), Jensen Huang’s silicon empire posted revenue of $44.1 billion , soaring past the $43.3 billion consensus.
That’s a 69% year-over-year gain, in case anyone’s still doing the math. Adjusted earnings of 81 cents per share also easily crushed expectations.
Shares popped 5% in after-hours trading Wednesday and then pulled back a little bit during the cash session on Thursday — not quite a moonshot, but a confirmation that even if Nvidia’s guidance was meh, this earnings report was meh’gnificent.
So what exactly is fueling this unstoppable juggernaut? And is there anything that could actually throw a wrench in the gears? Grab your chips (there’s your pun), let’s break it down.
💾 Data Centers: The Company’s Cash Cow
If Nvidia is famous for anything, it’s that it’s really able to see the trend before the crowds pick it up. From gaming, to crypto… and now? The star of the show now is data centers. But there's not just any growth. We’re talking $39.1 billion in data center revenue, up 73% from last year. That’s nearly 90% of Nvidia’s entire business. Not exactly fans of revenue diversification, are we?
Big Tech is gorging on Nvidia’s AI chips like it’s an all-you-can-eat GPU buffet. Amazon NASDAQ:AMZN , Google NASDAQ:GOOGL , and Microsoft NASDAQ:MSFT alone account for nearly half of that segment.
Basically, if you’re building anything with the words “large language model,” “AI agent,” or “sovereign compute,” you’re probably writing big checks to Nvidia.
🇨🇳 About That $10.5 Billion Problem
Thanks to Trump’s H20 export ban, Nvidia’s revenue from China is expected to take a $10.5 billion hit over two quarters. That’s an $8 billion crater forecasted for the current quarter, on top of a $2.5 billion gap in the previous one.
Is that bad? Maybe. Does anyone care right now? Not really.
Because here’s the kicker: demand outside China is so nuclear that even subtracting ten billion bucks over six months doesn’t materially derail the bullish narrative. Nvidia’s still forecasting $45 billion in revenue this quarter, which is basically flat — but considering what’s missing, that’s a win in disguise.
📦 Blackwell to the Rescue
The forward guidance may have missed the Street’s expectations — Nvidia projected Q2 revenue of $44–$46 billion, versus the $45.9 billion consensus — but CEO Jensen Huang already served the antidote: Blackwell Ultra.
These next-gen chips are already shipping to early customers. They promise to be leaner, meaner, and more power-efficient — basically, think McLaren but for AI accelerators. And they’re expected to ramp up aggressively in the back half of the year.
That means Nvidia has a new growth lever just waiting to be pulled. Some overly bullish analysts say it could eclipse the H100’s success.
💡 The Real Moat? It’s Not Just the Chips
What makes Nvidia such a rare beast isn’t just its hardware. It’s the ecosystem — CUDA, software stacks, developer tools, APIs, vertical integrations. It’s like Apple, but for the AI industrial complex.
Everyone wants to build an AI empire, but good luck doing it without Nvidia’s infrastructure. It’s not just expensive — it’s essential.
In the meantime, AMD NASDAQ:AMD and Intel NASDAQ:INTC are trying. There’s chatter about custom silicon from OpenAI (still a private company) and Meta $META. But for now, the moat around Nvidia looks more like a canyon.
🧨 So What Could Slow It Down?
But let’s not get carried away — there are still some real risks on the radar. Here’s what might actually trip up the AI king:
Geopolitical shocks: More export bans? Chinese retaliation? Taiwan tension? Any of these could make markets twitchy.
Supply chain constraints: As demand grows, so does pressure on foundries like TSMC 2330 . Any hiccups in advanced packaging or wafer starts could pinch margins.
Rising competition: AMD’s MI300 is no slouch. And Big Tech is building in-house chips to lessen reliance on Nvidia.
AI fatigue: If the AI hype cycle fizzles out or hits a plateau (remember the metaverse?), that could cool capital spending. It only takes 3-4 tech titans to pull their capex and Nvidia’s reign is over.
But until any of that materializes, the narrative for many is "Buy the dip — Jensen’s grip won’t slip."
💫 What’s Priced In?
The stock’s P/E is still sky-high, and the multiple implies several more years of 50–60% annual revenue growth. That’s hard to sustain indefinitely. But then again, so was becoming the second-largest company in the world… (and the biggest one, if only for a while ) and here we are.
Nvidia’s valuation is steep, but not unjustified — as long as it keeps executing. And judging by any of the previous quarters going back to 2023, execution isn’t a problem.
👩🏻🚀 More Than a Stock — Macro Theme
At this point, Nvidia has transcended chipmaker status. It’s now a macro story. Betting on Nvidia is betting on AI. It’s betting on infrastructure. It’s betting on the next industrial revolution in software, automation, and language models.
So… what can stop it? Share your thoughts in the comment section!

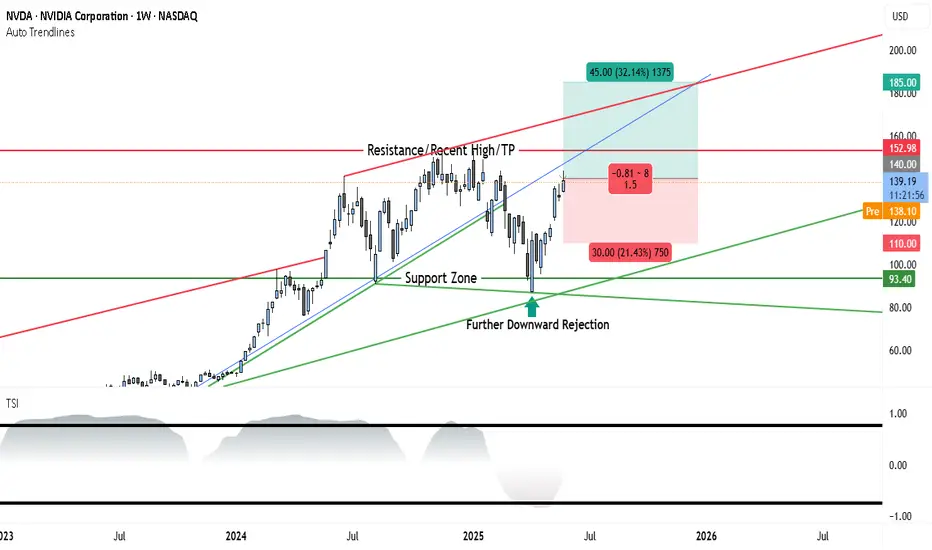
NVIDIA Stock Weekly Outlook: Support Holds Strong as $185 TargetThe weekly chart of NVDA shows a strong continuation pattern forming after a period of consolidation and a healthy pullback. The recent price action confirms a bullish stance, with a fresh bounce off support and momentum gradually shifting in favor of the bulls.
________________________________________
Long-Term Uptrend Confirmed
The blue ascending trendline drawn from early 2023 remains intact, showing that the overall trend is still bullish. NVDA has respected this trendline multiple times, with each touch followed by a renewed upward move. This week, the price rebounded once again near this trendline, confirming its role as dynamic support and signaling renewed buying interest.
________________________________________
Resistance and Breakout Potential
The key resistance level is marked at $152.98, which represents the recent weekly high and a psychological barrier. This level has acted as a ceiling in past attempts, but the current structure and momentum suggest a potential breakout if volume confirms. Above this level, there's clear air up to $185, where the next major resistance sits, and which also acts as the projected target in this trade setup.
________________________________________
Support Holding Strong
A strong support zone around $93.40 is clearly defined and has already triggered multiple rejections. NVDA recently saw a sharp bounce from this zone after a downward rejection, signaling that institutional buyers may be active here. This area is the foundation of the current bullish case.
________________________________________
Momentum Turning Favorably
The True Strength Index (TSI), shown at the bottom of the chart, is emerging from a low region. While not yet fully bullish, the indicator is starting to turn upward, suggesting early signs of momentum building. If TSI crosses above the midline in coming weeks, it could confirm the start of a sustained upward move.
________________________________________
Trade Setup
• Entry Zone: $138 to $140 (current price range)
• Stop-Loss: $110 (beneath the last significant swing low)
• Target: $185 (aligns with the next major resistance and top of risk-reward box)
• Risk-Reward Ratio: Approximately 1.5:1
• Setup Bias: Swing to mid-term bullish continuation
________________________________________
Conclusion
NVIDIA’s weekly chart is aligning in favor of the bulls after a healthy consolidation and support retest. The price remains within a strong uptrend channel, and momentum is gradually improving. A breakout above $152.98 would likely attract more volume and set the stage for a rally toward $185. The risk-reward setup is favorable, making this a strong candidate for bullish swing positioning heading into Q3 2025.
NVIDIA 1D — When “Head & Shoulders” Aren’t Just for the GymOn the daily chart, NVDA has broken out of the descending channel and reclaimed the 50-day moving average (MA50), triggering a classic inverted head and shoulders formation. Price is now holding above the key $113–$114.50 zone, confirming a structural shift. As volume picks up, buyers are eyeing the next levels of resistance.
Near-term upside targets: – $119.80 (0.5 Fibonacci) – $127.62 (0.382) – $137.28 (0.236) — primary resistance zone – Extended target — $152.91 (1.0 Fibonacci projection)
Technical setup: — Breakout from channel + above MA50
— Inverted head and shoulders pattern completed
— $114.50–$118.00 now acts as buyer support
— EMA and MA convergence supports trend reversal
— Increasing volume on rallies supports bullish momentum
Fundamentals: NVIDIA remains the AI and semiconductor sector leader. Growing demand for high-performance GPUs in AI and data centers positions NVDA as a core tech play. Expectations of strong earnings and continued institutional accumulation support the bullish narrative.
The confirmed breakout and inverted H&S setup mark a clear structural reversal. As long as price stays above $114.50, the path toward $127–$137 remains the primary target zone, with $152.91 in sight if momentum continues.

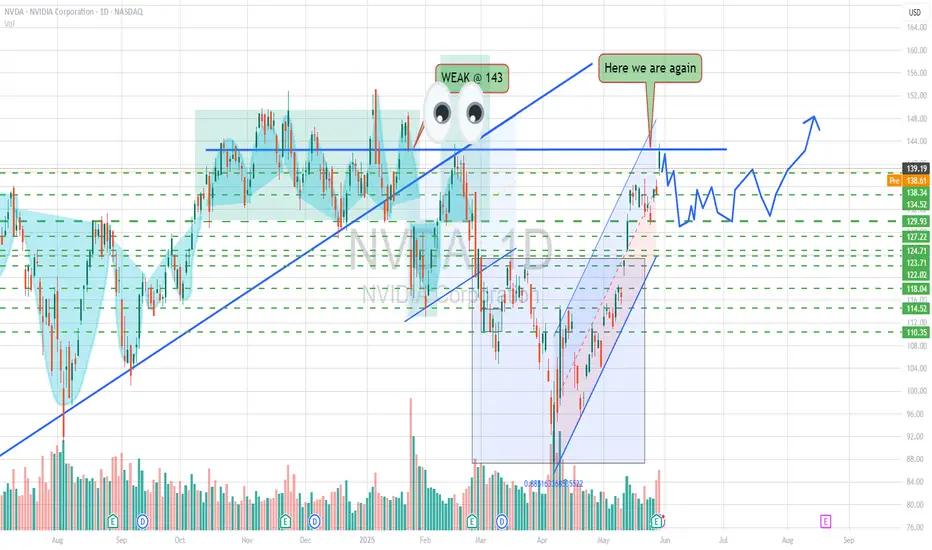
NVDA: Ascending triangle break, bull flag on S/R retestHey traders! I'm back and once again, I've spent almost the whole evening (lol) trying to figure out the odd, strange price action we've seen from NASDAQ:NVDA over the past few weeks, and especially today!
As we all know (I assume), Nvidia failed to disappoint on earnings once again, and we saw a HUGE gap up overnight, as far as up to the $143 mark. However, we soon began to see a dip. That's fair, as traders will likely sell and take profit.
However, the dip became a larger dip, and Nvidia finished the day basically at 3.2%. But it seems that the pullback may been pretty healthy.
Because as you can see from the chart, Nvidia has been forming an ascending triangle ever since the 14th May. That was after the sweet run it had prior to that. It has tested the £136-137 area as a major resistance line ever since until finally, a strong earnings report sent Nvidia above the line.
After the gap up, throughout the day, the stock went into a controlled, composed downward channel which what we like to call, a bull flag. This is taking into consideration market hours, not extended hours. This bull flag is bullish in its own way, but it is also a sign of a retest of the $136-137 resistance zone. This is officially a support zone now.
A successful retest from this support zone will cause a bounce, especially from the support trendline, and likely send the stock towards $140+, possibly extending its reach to $150 if broader market strength (Nasdaq) continues.
On the contrary, a dip below the support line and a crash below the red support trendline, would likely send the stock lower to $133 as next support.
As long as Nvidia maintains $136-137, the bulls are in control.
Note: Not financial advice. Please do your DD.

Nvidia - The bullish consolidation flag!Nvidia - NASDAQ:NVDA - is still quite bullish:
(click chart above to see the in depth analysis👆🏻)
After Nvidia retested a major horizontal support just last month, we witnessed an extremely strong bullish reversal candle which resulted in a strong +50% rally. Considering the bullish flag consolidation, a breakout is much more likely, but not in the immediate future.
Levels to watch: $150
Keep your long term vision!
Philip (BasicTrading)

Nvidia Maintains Bearish Bias After EarningsNvidia released its quarterly earnings yesterday, and since then, market confidence triggered a significant bullish gap that pushed the stock price up by nearly 5%. However, in recent hours, a new bearish bias has started to emerge, steadily closing the gap as the market digests the company’s latest report.
Nvidia reported $44 billion in revenue, slightly above the $43 billion expected, while earnings per share (EPS) came in at $0.77, below the $0.87 forecast. Nevertheless, the most notable aspect of the report was the announcement of an estimated $8 billion revenue loss due to U.S. export restrictions. In response, CEO Jensen Huang strongly criticized these measures, warning that they could negatively impact the company’s performance in the coming months.
Uptrend Channel Remains Intact
Since early April, Nvidia has maintained a steady upward channel. Although a slight bearish bias has emerged recently, it is not yet strong enough to pose a threat to the broader bullish trend seen in recent months. Therefore, this technical structure remains the most important pattern for the upcoming sessions.
Technical Indicators:
RSI: The Relative Strength Index has begun to show signs of a possible bearish divergence, as lower highs on the RSI contrast with higher highs in the stock price. This mismatch could signal short-term corrective movements.
MACD: The MACD, meanwhile, continues to oscillate around the zero line, indicating a balance between buying and selling pressure. As long as the histogram remains near this level, it suggests neutral momentum in price direction.
Key Levels to Watch:
$140 USD: Current resistance level where short-term selling pressure may emerge.
$150 USD: Distant resistance around January highs. A breakout toward this level could support a stronger bullish channel.
$125 USD: Important support that coincides with the 200-period moving average. A bearish move toward this level could break the current bullish formation.
Written by Julian Pineda, CFA – Market Analyst

Nvidia after earningsSo , now the earnings were overall good, I actually do not care so much about earnings but more about expectations which were very good. Were still in a weak market sentiment, and in a summer hole with low liquidity, but I need to admit Nvidia is the star of the market for now.

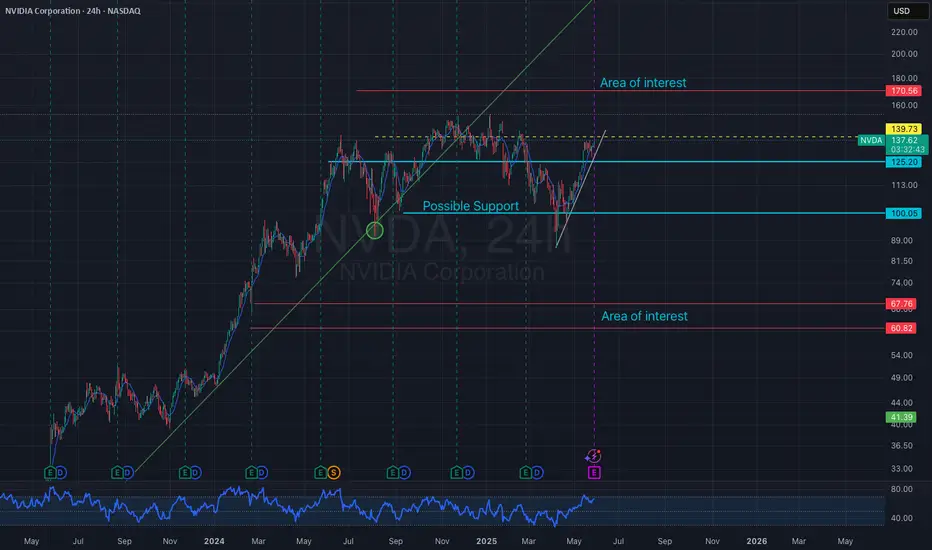
NVDA roadmap of Support / Resistance levels going into Earnings
NVDA earnings soon that the entire world will be watching.
Plotted are key levels mapped by its Genesis and Covid fibs.
Look for the move to stop and rebound at one of these zones.
$ 140.35-141.09 is the first resistance above.
$ 148.64-150.04 is the All Time High resistance.
$ 122.25 is a Golden Covid fib for bulls to hold.
$ 111.63-113.56 is pretty much Bulls' Last Stand
See "Related Publications" links to the right ----------->>>>
for previous plots that played out EXACTLY.
.

Nvidia Stock Price Rises Over 4% Following Earnings ReportNvidia (NVDA) Stock Price Rises Over 4% Following Earnings Report
Yesterday, after the main trading session, Nvidia released its quarterly earnings report, which exceeded analysts' expectations:
→ Earnings per share: actual = $0.81, forecast = $0.73
→ Revenue: actual = $44 billion, forecast = $43.3 billion
Additionally, according to media reports, Nvidia issued a strong forecast for the next period, although CEO Jensen Huang noted difficulties in accessing the Chinese market, which he estimates to be worth $50 billion.
Nevertheless, market participants reacted positively. According to Google, in after-hours trading the NVDA stock price rose by more than 4%, surpassing the $140 level.
It is reasonable to assume that this initial positive reaction could continue during today’s main trading session.
Technical Analysis of NVDA Chart
As we mentioned earlier this week, NVDA stock in 2025 has formed a broad descending channel (shown in red), and just before the earnings release, the price was consolidating near the upper boundary of this channel.
We also suggested a scenario in which the bulls might attempt to break through the upper boundary of the channel. Given the positive earnings report and the stock market rally following the Federal Court’s decision declaring Trump tariffs invalid, the likelihood of this scenario increases.
This, in turn, means that:
→ the upper boundary of the channel, once broken, may act as support;
→ we may once again see the key psychological resistance level of $150 come into play — a level we have highlighted multiple times before.
This article represents the opinion of the Companies operating under the FXOpen brand only. It is not to be construed as an offer, solicitation, or recommendation with respect to products and services provided by the Companies operating under the FXOpen brand, nor is it to be considered financial advice.

SHORT Nvidia, Bearish Chart Setup, Resistance ConfirmedThe resistance from 21-May has been confirmed 28-May.
The same level has been working as resistance since 14-May.
After two weeks, this resistance level continues to hold and it is now confirmed.
In November 2024 NVDA produced a high.
Later in January 2025 NVDA produced an all-time high.
18-February 2025 NVDA went to produced a lower high; a rejection that led to a major drop.
The major drop resulted in a recovery and the recovery found resistance earlier this month. This resistance, the same from 14-May, 21 and 28-May, is also a lower high compared to the previous levels just mentioned.
The signal here is double: (1) Resistance confirmed and (2) a lower high.
There is one more. 28-May produced a volume breakout day. The day ended up closing red. So, Nvidia is confirmed bearish now.
Thank you for reading.
Namaste.

NVDA GEX Earnings Outlook by OptionsNVDA reports earnings this Wednesday, and it’s a big deal. A major move could impact both the indexes and broader tech sector.
The OTM 16 delta curve essentially overlaps with both the GEX profile and the expected probability zone — signaling strong confluence.
📈 Rising IV with falling call skew: Volatility is rising into earnings, while the call skew is dropping — a sign of growing interest in downside hedging/speculation.
🔷 Key inflection zone (129): Above 129, the market is unlikely to surprise. Below it, however, a domino effect could trigger increased volatility and put-side flows.
Implied move into earnings is 6.62%, reflecting binary risk expectations from the options market.
Strong gamma squeeze territory exists between 140–145, with significant call wall buildup around 140.
The nearest expiry shows a positive net GEX — supporting short-term mean-reversion or hedging flow stability above 129, at least until the earnings print.
🔴 Downside risk scenario:
In the event of a downward move, the market is most heavily hedged around the 125 level, which aligns with the deepest put support.
💡 Wheeling Opportunity Idea
ONLY IF you want to own NVDA long-term around the $130 level (even if it drops short/mid-term), this might be a great time to start the wheeling strategy.
Because earnings inflate volatility, you can sell a near-term cash-secured put (CSP) for solid premium — even on a 53DTE (July) option.
Based on current GEX levels, we’re seeing:
-Support (squeeze zone) around $125
-Call resistance around $140
-A potential upside squeeze extending to $145-$150
These align roughly with ~20 delta OTM options, so the premium is attractive.
How would I personally start this:
Sell a CSP for May 30 with the intention to get assigned if NVDA drops.
If I do get assigned, I’m happy to own shares.
Then, I sell a 60DTE covered call right after to collect another round of premium.
If I’m not assigned, I sell a new 45–60DTE put the following week — still benefiting from the relatively high IV.
👉 Remember: High IV = synthetic time value. With this two-step method, you can harvest premium twice in quick succession.
I used the same technique with NASDAQ:INTC , and it’s been performing well.
💥 ONLY IF you want to own NVDA long-term around the $130 level (even if it drops short/mid-term)!

NVIDIA/USD 4 HR./ CORRECTIVE WAVE B NORTH IS LIKELY OVER!1). Price is very likely heading towards the fair Market value @ 123! 2). Risk Assets are Weak today on US$ strength! 3). BANKS ARE SELLING! 4). Volume is dropping. 5). Trendline is intersecting with target fib. level 100% TOWARDS 123! 6). Corrective wave C is likely dropping to complete wave 4. 7). At the bottom of wave 4 we will look for a long (Buy) position!

NVDA Q1 Earnings: Strong Fundamentals Amid Geopolitical NoiseDespite recent trade restrictions, Nvidia has shown remarkable operational strength, beating expectations with $44.1 billion in revenue and a 73% YoY growth in its data center segment, fueled by rising demand for artificial intelligence. While international tensions led to a projected $8 billion loss, the market responded with confidence—viewing it as a temporary adjustment rather than a structural threat. This strong financial position supports our CALL contract entry, which is already gaining value. If tomorrow’s GDP data confirms economic stability, we could see another bullish move, and if our technical target is reached, we’ll exit as planned.
All eyes on NVDABullish or Bearish? Where do you think we are going? Let's see how hard this move will be and how much it will affect the rest of the market. Be careful and GL! Lets see if we can hit some targets
$NVDA - head and shoulders + possible bull shark harmonicOn my chart, NVDA appears to be potentially forming a head and shoulders pattern.
At the same time, an almost perfect bullish shark harmonic woukd comple around the target for the head and shoulders pattern.
Could be something, could be nothing.
But I'll be careful and not spend my money on NVDA just yet.
Positive earnings might invalidate this idea and send NASDAQ:NVDA to the moon instead.
Let's see what happens.

NVDA ER targets!!
144-148 for bullish news, beats expectations
123-126 for meeting expectations, base case
111-114 for missing expectations
TL;DR I favor the short side...I'd open an ITM bearish Broken Wing Butterfly. But it's too much risk for my port so I'm staying out.

SPX Bullish Patterns Emerging ahead of NVIDIA EarningsThe SP:SPX has taken out some major pivots and recaptured the ever so important daily 200 MA.
across multiple time frames some very interesting bullish patterns are emerging.
All eyes will be in NASDAQ:NVDA earnings tonight after the bell.
If NVIDIA beats and guides it will breakout of an epic bull flag pattern that will likely casue this market to trend to new All time highs.
Probabilities from a technical pattern standpoint are pointing towards higher price action.
We have already broken out and back tested key support levels and the buying is clearly being observed.
We remain net long with positions already in profit.

NVDA LONGNVDA is a long term buy from here. With earnings later today, we can expect a big push up into our purple zone. I am holding my positions strong!
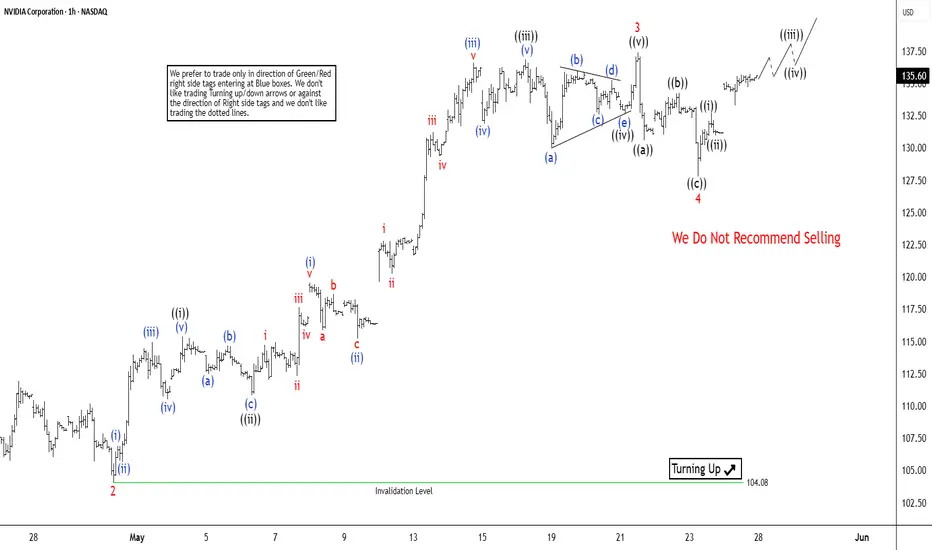
Nvidia (NVDA) Elliott Wave Analysis: Wave 5 Nearing Its EndThe short-term Elliott Wave analysis for NVIDIA (NVDA) indicates a bullish trend unfolding as an impulse structure since the low on April 21, 2025. From that low, the stock completed wave 1 at $111.92. The stock then followed by a corrective pullback in wave 2, which bottomed at $104.08. The subsequent rally in wave 3 displayed strong momentum, characterized by a nested impulse structure in a lesser degree. Within wave 3, the first sub-wave, wave ((i)), peaked at $115.40, with a brief dip in wave ((ii)) to $110.82. The powerful wave ((iii)) surged to $136.89, followed by a shallow pullback in wave ((iv)) to $132.65. The final leg, wave ((v)), concluded at $137.40, completing wave 3 on a higher degree.
The corrective wave 4 unfolded as a zigzag pattern. From the wave 3 peak, wave ((a)) declined to $130.59, wave ((b)) rebounded to $134.23, and wave ((c)) completed the pullback at $127.80, finalizing wave 4. NVIDIA has since resumed its upward trajectory in wave 5. As long as the pivot low at $104.08 holds, the stock is expected to extend higher in wave 5, completing the cycle from the April 21 low. Following this, a larger-degree three-wave pullback is anticipated, offering a potential pause in the bullish trend.
$140 NVDA to the downside?I am seeing a previous ORD Block to be tested at $139/140 after that I might expect some sort of "news" to break and start a selling to fill both Gaps on the downside before it continues.
It might happen or not, but my experience shows me manipulation is quite real. And we got to account for that guy that saw the market collapse before anyone you know that famous housing problem that even made a movie about it? He is shorting NVDA as well. I do not believe in any of them, but I would be careful. Unless NVDA doesn't break strongly above $140 and retest without problems. I would bet going down eventually too.
For now going up.
