$OXY Still in Play for This WeekThat $63 level I mentioned on my July 6th post came into play perfectly.
Focus heading into next week.
In my book, this setup gotten better with that rejection. Key is how it acts early next week. $OXY
OPC trade ideas

$OXY with a Bullish outlook following its earnings #Stocks The PEAD projected a Bullish outlook for $OXY after a Positive Under reaction following its earnings release placing the stock in drift A with an expected accuracy of 40.

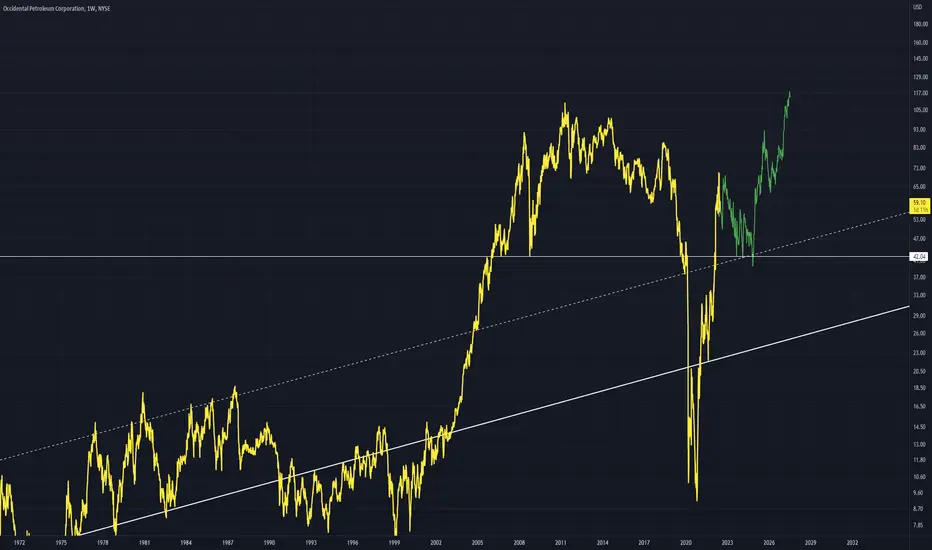
Why Warren Buffett pours billions of dollars into OXY ?Legendary investor Warren Buffet is pouring billions of dollars into Occidental Petroleum Corporation ! when it rejected heavily from strong and valid down trend line ! why ?
Please note Buffett is a long term investor not a trader !. US market has been in a Bull run in large time frames (Yearly or Monthly) since 1932 therefore, any long term investor who chose fundamentally powerful stock has made a huge profit.
Although I believe Berkshire could have chosen better time and maybe lower price to start buying shares of OXY, I think it will see higher prices in long term in fact, It goes much higher than ATH and will reach to around 180 USD per share or even higher in up coming YEARS.
Now , lets look at what we have in technical point of view:
1. OXY was rejected strongly from valid down trend line in weekly time frame for 4th time . Break out of this heavy down trend line is very important for the stock to go higher.
2. In terms of Elliott waves, similar to many other energy stocks like XOM, COP, SLB and etc , OXY has completed and ascending complete wave cycle from IPO to latest major low (Primary degree waves 1 and 2 on the chart shown by green and red arrows respectively ). It means that impulsive section (Primay degree wave 3) of new wave cycle has been started at last major low around 9 USD. In closer look, currently we are in wave 4 of 1 of primary degree wave 3. Elliott wave labeling on the chart shows internal waves (12345) of wave 1 of primary degree wave 3. It means there is one more leg up ( wave 5 shown on the chart ) to complete wave 1 of primary degree wave 3. Then we will probably have a major correction (wave 2 of 3 ) down to 40-50 level and after completion of correction , wave 3 of 3 which is most profitable and most speedy wave will start. Please note this is most probable scenario and we are not talking about certainty.
3. Beside strong down trend line, there are many strong static resistances on OXY climb road. These Resistances are shown by red horizontal lines on the chart. Therefore, OXY will face difficulties on the way to reach it's target.
One more important note :
As Berkshire owns now around 20 % of company shares and they are long term holders, We can somehow be sure that 20 % of shares of company will be out of future sell pressure in up coming years which is very important note to be considered.
All in all, I believe OXY , like many other energy stocks , offers huge profit for long term investor and traders. However, Is it a right time to open a long position? It depends on personality and risk management and patience of investors/traders. I myself, keep OXY in my watch list and think it can be bought on lower prices as shown by green lines. To me, buying a stock when it is struggling with a strong down trend line is dangerous and as always, I am seeking for a safe trade set up.
I Hope this publication to be useful and wish you all the best.

$OXY strong in face of Oil SellingAmazing how well $OXY held up in the face of brutal selling in #oil and other oil names.
While this looks like a possible head and shoulders, an unexpected move over $63 (above right shoulder) is very bullish.
Keep an eye on this. It'll make its move soon. Volatility is coiling!

Occidental Petroleum (NYSE: $OXY) Back @ 2016, 2017 & 2019 LowsOccidental Petroleum Corporation, together with its subsidiaries, engages in the acquisition, exploration, and development of oil and gas properties in the United States, the Middle East, Africa, and Latin America. It operates through three segments: Oil and Gas, Chemical, and Midstream and Marketing. The company's Oil and Gas segment explores for, develops, and produces oil and condensate, natural gas liquids (NGLs), and natural gas. Its Chemical segment manufactures and markets basic chemicals, including chlorine, caustic soda, chlorinated organics, potassium chemicals, ethylene dichloride, chlorinated isocyanurates, sodium silicates, and calcium chloride; vinyls comprising vinyl chloride monomer, polyvinyl chloride, and ethylene. The Midstream and Marketing segment gathers, processes, transports, stores, purchases, and markets oil, condensate, NGLs, natural gas, carbon dioxide, and power. This segment also trades around its assets consisting of transportation and storage capacity; and invests in entities. Occidental Petroleum Corporation was founded in 1920 and is headquartered in Houston, Texas.

Buy OXY in US stock market ? 4/7/2022You can buy it
Target 68.41 stop loss 54.43
money management is your responsibility
I recommend entering a maximum of 10% of the portfolio.
good luck

$OXY hourly bullish breakout in progres$OXY is looking like a bullish setup into next week. Extremely strong hourly buy signal.

OXY in a downtrend channel (bearish) 🔴I am expecting continuation down to 51-52 area before a potential short term bottom is in here .

OXY - Recovery After Small FallOXY has developed a strong trend line in solid white
The dashed trend line is a slightly weaker trend line
A small drop and support bounce will lead price to new highs
Betting against the BuffetI'm not saying this doesn't go higher eventually, but a pullback to 42 area (breakout zone) looks likely first. Aligns with my view on oil.

HOW TO: Using Notes To Capture Why You Took A TradeThought I would make a video on a really simple and integrated way to help you record why you took a trade and what the chart looked like at the time without having to publish it.
TradingView Notes allows you to take a screen capture of the chart as well as your indicators and drawings being used at the time and easily recall them.
Well worth using if you want to help improve your trading and find similar setups.
Hope you like it.

$OXY Bearish Sentiment - In Line with Energy Sector Rather than look at XLE or the energy sector as a whole - looking at an integrated Oil and Gas company with more volatility gives us a better picture of the environment. There are obviously severe worries of a recession - hence the breaking of correlation between OXY and OIL futures the past couple days. With oil futures falling as well, the backdrop sets a fairly bearish tone for the short term. Looking at the levels, OXY could fall into the mid 40s prior to consolidation and then possible bullish setup.
Bullish case: Russia and/or OPEC production shortages supply constraining...US Demand stays strong...GDP growth stays positive for Q2
Bearish case: Oil continues to fall due to expected demand falling... Russia/OPEC issues subside/aren't as bad as expected...Fiscal policies before midterms

OXY and W.A+WTZ4 SetupOXY is likely moving on W.A after the whole impulse wave completely ended. I wait for it break down W.iv of V before entering to make sure W.A begin. Normally when W.3Ext. impulse is ended, the first corrective wave will end at least wave 4 of the previous impulse. So, I apply WTZ4 for checking my analysis and strategy. Enjoy your trading.

Oxy on its path to $55. Oxy is in a downtrend and will see belo $60 soon with a potential to hit around bottom of the price action which is around $53 soon. IMO. Please trade safe as this is not a financial advixe

OXY Bearish DivergenceOXY displaying bearish divergence on the weekly chart, reaching new price highs on dwindling RSI. Support around 57.86

OXY Crowded Power PlayAnother Oil & Gas Power Play. 100% or more in less that 8 weeks. Been trading tight and holding since March. Overcrowded trade. IMO it makes more sense to buy oil names on pull backs to the 50 day than on breakouts but will give it small go again as it broke out today from tight area.

watching for consolidation breakout 👀hit our first target to upside I mentioned in last analysis so congrats to OXY longs!
now we are struggling to break past our first target again (71.65) and near RSI resistance!
be ready to play both sides in this market, watching for longs above 71.55, shorts below 67.03/trend support.
also please dont forget to like and follow if you enjoy my analysis, thank you! ♥

OXY Looking To Short This Name In The $90 Area Title says it all IF and that's a BIG IFOXY can get back to $88 / $90 we will get short this name NOT BEFORE Not Advice Do your Own DD And Follow @dRends35 on these names

26/5/2022 NYSE (OXY)Buy (Entry Price) above the black line and exit (Stop Loss) below the red line. Can take profit at the suggested Target Price.
Entry Price: $66.53
Target Price: $67.90
Stop Loss: $64.24


is it a real breakout? or just a trap.. lets see!! OXY currently trying to breakout from the 3 month consolidation faze, it looks like a potential fake out breakout though so longs should be cautious.
If breakout can hold and we see continuation to upside my targets are 71.61-81.65-91.69
but break below 61.14 and it can go back to 51-53 supports

OXY - Energy Sector Still Strong1) High Tight Flag on the weekly supported by extremely strong buying volume.
2) Tight consolidation observed on the 30 min with greater buying volume and smaller selling volume.
3) Risk : Reward for the trade is 1:3
4) Not financial advice, happy trading!

Long scalp OXYBased on its uptrend, rebound from support and a familiar chart pattern confirmed by my technical indicators, I expect at least half a percent in profits IF OXY exceeds yesterday's high of $60.23 during today's session.
