AVOID: $PEP Has a rich valuation for a low single digit growth! - Avoiding NASDAQ:PEP , Some people are saying it's undervalued. Please hold my beer.
- Company has almost saturated, Good days are behind us. Only way this company can grow is by raising prices which means price gouging and adjusting prices for inflation.
- Single digit EPS growth. Forward p/e an should be less than 10 for this stock to be attractive. Otherwise avoid this company as there are better investment opportunity in the market.
- Fundamentally.
Year 2025 2026 2027 2028
EPS. 7.92. 8.40 8.90 9.04
EPS % -2.71%. 6.02%. 5.93% 1.59%
Fair forward p/e for a low single digit EPS growth should be 10
Fair Stock Value:
Year 2025 2026 2027 2028
Stock price 89.2. 84 89 90
Some investor might be willing to pay more if economy tanks and money move into defensive stocks. In that case, investors might pay forward p/e of 15
Fair Stock Value:
Year 2025 2026 2027 2028
Stock price 118 126 133 135
PEP trade ideas

PEP...ready to pull the trigger and go long?These are my favorite indicators...still learning as I'm a LT player not a trader. Any critical comments are welcome.
PEP
Yield : 4.26% vs 5 yr avg 2.89%
Credit rating : A+
Beta : 0.47
Fwd PE : 16.7 vs 5 yr avg 23.0
If anyone has any other indicators that are better than these ones for identifying LT entry points...please advise and thank you in advance!
busted
4/25/25 - $pep - ST trade... *again* low $130s4/25/25 :: VROCKSTAR :: NASDAQ:PEP
ST trade... *again* low $130s
- have seemed to bottom tick entries in the past
- i "get" results "sucked", what's new in this environment for a co like this NYSE:PG results weren't much better IMHO
- but the global snack king is unlikely to be dethroned anytime soon
- 4.5% fcf yields legit
- mid teens PE too cheap, or closer to 20x debt-adjusted for great brands
- so swinging on the ST action
V


$PEP $150 retest Hi, liking NASDAQ:PEP here for a retest of mental price $150. NASDAQ:PEP is at 4 year lows, was at four year lows and bounced twice off $141 zone. Short term $150c could be a play here for April expiration but also could be patient and see if it retests the supply zone of $140. This is on watch. Just acquired Poppi brand as well. Overall it could be forming a rising wedge, not definitive on that thesis just yet, though.
NFA
WSL

PepsiCo: A Dividend King at a Discount – Time to Buy?PepsiCo, Inc. (PEP)
- Sector: Consumer Defensive
- What It Does: Produces beverages and snacks, like Pepsi, Frito-Lay, and Quaker products.
Fundamental metrics
- Dividend Yield: ~3.5%
- Payout Ratio: 67.8%
- 5-Year Dividend Growth Rate: 7.2%
- Debt-to-Equity Ratio: 2.05
- Return on Equity (ROE): 50.8%
- Price-to-Earnings (P/E) Ratio: 18.9
- Price-to-Book (P/B) Ratio: 11.6
- Analyst Average Price Target: $167.00
- Consecutive Years of Dividend Increases: 53
--------------------------
Technical Factors
The stock is currently experiencing its largest correction since the COVID flash crash, with the last major downturn occurring during the 2008 financial crisis. In such a rare scenario, it's worth considering adding one of the top Dividend Kings to your portfolio.
These companies, with a track record of increasing dividends for 50 consecutive years, tend to be financially stable and reliable, making them an attractive option during market corrections. Their consistent dividend payouts offer a solid income stream, providing a level of security in uncertain times.
Criteria:
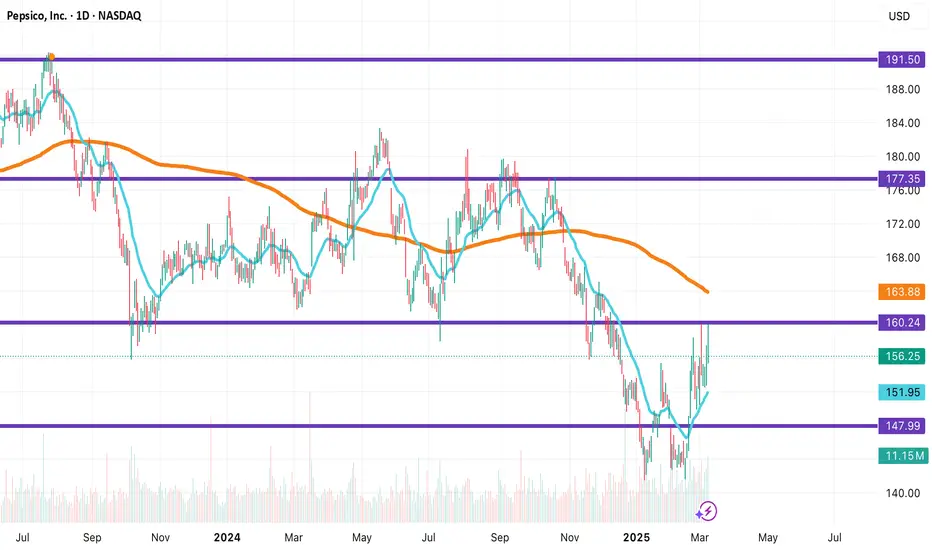
- Mid-round number at $150, acting as a psychological level
- Channel projection from the top, aligning with the price structure
- Equal waves from the top, suggesting symmetry in the correction
- Previous resistance levels turning into support, reinforcing the zone
- A key trendline inside the marked box, the last missing touch
The price has already met most of these criteria, except for the trendline, and it has rejected upwards twice from this zone. That’s why this level presents a solid long-term opportunity to consider an entry from current levels.
Make sure to conduct your own fundamental research to ensure the investment aligns with your investment thesis. While I can provide a technical "green light," it’s crucial to confirm that it also fits with the underlying fundamentals.
Before you leave - Like & Boost if you find this useful! 🚀
Trade smart,
Vaido

PepsiCo (PEP) – A Strong Long Setup for 2025📈 Ticker: PEP
📊 Timeframe: Swing trade (3-6 months)
🎯 Target Price: $190 - $200
⏳ Entry Zone: $160 - $165
🛑 Stop Loss: $148
🔹 Thesis for the Long Trade
PepsiCo (PEP) is a defensive consumer staple stock with strong brand power, consistent revenue growth, and a resilient business model. As market volatility increases due to macroeconomic concerns, investors tend to rotate into high-quality dividend-paying stocks like PEP.
Despite some near-term pressure from inflation and shifting consumer preferences, PepsiCo’s diversified portfolio (beverages & snacks) and global expansion efforts continue to support long-term growth.


Campaign trading Pepsico back to $180PepsiCo has made significant efforts to improve the health profile of its products. Here are some key points:
Reduced Added Sugars: PepsiCo has been working to reduce added sugars in its beverages. By 2025, they aim for at least 67% of their beverage portfolio to not exceed 100 calories from added sugars per 12-ounce serving.
Lower Sodium and Saturated Fat: They have also set goals to reduce sodium and saturated fat in their convenient foods. By 2025, they aim for 75% of their convenient foods portfolio to not exceed 1.3 milligrams of sodium per calorie and 1.1 grams of saturated fat per 100 calories.
Diverse Ingredients: PepsiCo is working to include more diverse ingredients like whole grains, plant-based proteins, fruits, vegetables, nuts, and seeds in their products. Their goal is to deliver 145 billion portions of these diverse ingredients annually by 2030.
Nutrition Science: PepsiCo's Health & Nutrition Sciences team focuses on understanding and translating nutrition science to support healthier choices.

PepsiCo: Strong ReactionThe Pepsi stock recently showed a strong reaction to the support at $141.52, reinforcing the significance of this level. However, we primarily anticipate that this level will be breached next. During the ongoing magenta wave (5), the price should drop into our beige Target Zone (coordinates: $131.12 – $124.50), which presents potential long-entry opportunities. We primarily expect the beige wave a to conclude within this Zone. But if the stock instead breaks above the resistance at $165.13 (probability: 31%), this will confirm that the low of the beige wave alt.a was settled prematurely.

PEPSI: That's what i like! Pepsico reported earnings on Feb 4.
Earnings per share: $1.96 adjusted vs. $1.94 expected
Revenue: $27.78 billion vs. $27.89 billion expected
For 2025, Pepsi is projecting a low-single-digit increase in its organic revenue and a mid-single-digit rise in its core constant currency earnings per share.
The company also announced a 5% increase in its annualized dividend to $5.69 per share from $5.42 per share. This marked the company's 53rd consecutive annual dividend increase!
Current valuations undemanding...
Forward pe ratio of 17.01 is lower than its 3Y average of 26.15
Forward pe ratio of 17.01 is lower than its 5Y average of 26.51
2 weeks since the results, the share price has remained rangebound while the oscillator has started moving higher, giving a signal of bullish divergence.

Bounce Off Floor for Pepsico. PEPThis is a second bounce post completion of a fairly obvious downward five wave impulse. Usually, when this happens more than twice, price action turns around and goes the other way. Despite lagging, the VZO/StochRSI combo both produced signals. vWAP and Ehlers Ultimate Smoother are both supportive.


PEPSIIII - Long Term Super Over Sold ConditionsThis play does not make the much sense to me via a fundamental perspective regarding the economic outlook of companies like PEPSI, Coke and $KO. But, from an investment standpoint, they control the food/drink market and have seen stagnant numbers and low growth regarding there products. Our new leader RFK Jr. in the food industry might start a complete overhaul of the products forcing these companies to rethink there targeted audiences/ marketing campaigns and adapt to this generations pallet.
Short term it needs to build more structure and a foundation, on the other hand watch out for a V shaped reversal in the coming weeks.
Target #1 - $155
Target #2 - $160
Target #3 - $170
Stop Loss - $140
Stay tuned for option position longs, I will personally be investing money in them as well.

PEPSICO READY FOR START...1. Technical Trends and Patterns
The price is testing a support area with a double bottom around 141-143 USD. This is a bullish pattern that signals a possible trend reversal.
There is a falling wedge, another figure that usually anticipates a bullish breakout.
The main resistance to overcome is around 153-155 USD, which coincides with a bearish trendline.
The Bollinger Bands are showing a contraction, suggesting that the price could explode in one direction (probably up, given the formation of the double bottom).
The previous resistance areas are at 170-175 USD, so if the breakout occurs, it could push up to those levels.
2. Technical Indicators
MACD: The histogram shows a weakness in the bearish trend, with the moving averages that are looking for a bullish crossover. A positive signal is confirmed.
RSI: Currently around 45, suggesting that the stock is close to the oversold zone, increasing the likelihood of a bounce.
Volume: Volume is slightly increasing at the second low, which could indicate accumulation by investors.
3. Possible Scenarios
Bullish (Bullish Scenario): If it breaks the bearish trendline and resistance around $153-$155, the stock could have a move towards $165-$170.
Bearish (Bearish Scenario): If it breaks the double bottom support at $141, it could fall to the next support area at $135.
Conclusion
The chart shows signs of a possible bullish reversal, but it is essential to see a confirmation above $153-$155. If volumes continue to increase and the MACD confirms a bullish crossover, they participate in a price recovery. Conversely, if the support is broken, there is a risk of a continuation of the bearish trend.


PepsiCo (PEP) Shares Drop 4.5% After Earnings ReportPepsiCo (PEP) Shares Drop 4.5% After Earnings Report
Yesterday, PepsiCo Inc. (PEP) released its investor report, which delivered mixed results.
Positive highlights:
→ Earnings per share ($1.96) exceeded expectations ($1.94).
→ Gatorade strengthened its market position.
→ Mountain Dew Baja Blast generated $1 billion in annual revenue.
→ International revenue grew by 2.1%.
→ The company announced a 5% dividend increase and expects growth in the protein drinks segment in 2025.
Negative factors:
→ Revenue ($27.78 billion) fell short of forecasts ($27.9 billion).
→ North American sales are declining, with Quaker Foods sales down 6%.
→ Foreign exchange fluctuations are weighing on overall revenue.
Investors reacted negatively, and by the end of the trading session, PepsiCo's stock price dropped by 4.5%.
Technical Analysis of PEP Stock
→ The price remains in a downward channel. While the S&P 500 has gained over 2% since the start of 2025, PEP stock has declined by more than 6%.
→ The $150 psychological level no longer acts as support (which was evident before the earnings release). The recent price rebound (marked with blue arrows) appears to be an interim recovery within the ongoing downtrend.
→ The stock is now trading near the median line of the channel, suggesting a potential stabilisation as supply and demand tend to balance at the median. However, bearish pressure may persist, potentially leading to a new yearly low.
Is PEP Stock a Buy?
Analysts remain cautiously optimistic. According to TipRanks:
→ Only 5 out of 11 analysts recommend buying PEP.
→ The 12-month average price target is $168.
Trade on TradingView with FXOpen. Consider opening an account and access over 700 markets with tight spreads from 0.0 pips and low commissions from $1.50 per lot.
This article represents the opinion of the Companies operating under the FXOpen brand only. It is not to be construed as an offer, solicitation, or recommendation with respect to products and services provided by the Companies operating under the FXOpen brand, nor is it to be considered financial advice.


Market Reversal or Just a Pause? PEPSI Faces a Pivotal MomentIs PEP Ready for a Breakout or a Breakdown?
NASDAQ-PEP finds itself at a crossroads, trading at $150.39, nearly 24% below its all-time high of $196.88 from May 2023. However, recent price action suggests that volatility is brewing. The stock has rebounded 6.2% from its absolute low of $141.51, recorded just 24 days ago, and is now hovering near key technical levels.
The 50-hour moving average (MA50) at $151.06 and 100-hour moving average (MA100) at $150.93 indicate that PEP is struggling to maintain upside momentum. Additionally, the RSI14 is at 39.18, signaling that the stock is nearing oversold conditions—historically a zone where buyers start stepping in.
Adding to the intrigue, a Buy Volumes Takeover pattern appeared on January 31, with an attempted push higher, but the main directional force remained bearish. Will buyers finally overpower the downtrend, or is this just another false hope before a deeper correction?
With resistance looming at $155.94, PEP needs a convincing breakout. Failure to reclaim this level could expose it to renewed selling pressure, possibly retesting lower supports at $149.14 and $146.45.
The question remains: Is this the last chance to catch an uptrend before PEP slips further? Stay tuned for the next move!
NASDAQ-PEP: Pattern Roadmap – The Market’s Hidden Clues
The market never moves randomly—every candle tells a story. Let’s break down the latest sequence of patterns that shaped NASDAQ-PEP’s price action and see which signals traders should have paid attention to.
January 27 - Buy Volumes Surge, Bulls Step In
Opening at $152.26 and closing at $153.57, PEP flashed an Increased Buy Volumes pattern, hinting at a bullish move. The next step? Confirmation was needed—would price hold above its recent lows and push higher?
January 28 - Bearish Shift as Sellers Dominate
Just a day later, the script flipped. A Sell Volumes Max pattern took over, pulling PEP down from $150.6 to $150.19. The abrupt reversal signaled a shakeout—weak longs got trapped.
January 29 - VSA Buy Pattern Brings the Bounce
The bulls fought back, forming a VSA Manipulation Buy Pattern. With a low of $150.23 and a push to $150.95, this setup hinted at smart money stepping in. The key was the low of the last three bars—a crucial trigger point for future movement.
January 30 - VSA Sell Triggers a Deeper Drop
Despite the previous day’s rally, VSA Manipulation Sell Pattern 2nd took control, closing at $152.01 from an open of $152.37. This was a textbook trap—prices moved up, only to be swept back down.
January 31 - Buy Volumes Takeover, Bulls Reload
After the prior day’s bearish push, another Buy Volumes Takeover emerged, attempting to shift control back to buyers. The range tightened, but was this a real reversal or another bull trap?
The roadmap shows a clear battle between buyers and sellers, with rapid shifts in direction. The market is at a tipping point—will bulls finally regain control, or is another sell-off looming? Stay locked in.
Technical & Price Action Analysis: Key Levels to Watch
Every market move is a test—either levels hold, or they flip into resistance. Here’s where the real game is played:
Support Levels:
$149.14 – First demand zone. If buyers step in, expect a bounce. If not, it flips into resistance, trapping late longs.
$146.45 – The make-or-break level. A failure here could open the door for a deeper dive.
Resistance Levels:
$155.94 – First wall for bulls. Needs a solid breakout to confirm upside momentum.
$163.18 - $165.15 – Heavy supply zone. If price stalls here, shorts will pile in.
$168.7 - $170.83 – Stronger hands waiting to offload. Only a clean breakout can shift momentum.
Powerful Support Levels:
$169.2 – If price ever reclaims this, the game changes completely.
$196.57 – The final boss level.
Levels are only as strong as their reaction. If support fails, these same levels will act as magnets for sellers, creating resistance on any pullbacks. Stay sharp—this is where the market traps traders.
Trading Strategies with Rays: Precision Entry & Exit Points
The market moves through a dynamic structure of Fibonacci-based rays, where each interaction defines the next move. These rays, combined with VSA (Volume Spread Analysis) levels, create a predictive map—guiding trades from one ray to the next.
Optimistic Scenario: Bullish Ray Interaction
If price interacts with the $149.14 support level and shows buying volume confirmation, we look for a move toward the next ray. The key signals:
Moving averages (MA50 at $151.06, MA100 at $150.93) aligning with price movement.
First target: $155.94 – the first strong resistance where sellers may emerge.
Second target: $163.18 - $165.15 – a breakout here signals trend continuation.
Third target: $168.7 - $170.83 – a full bullish scenario unfolding.
Pessimistic Scenario: Bearish Breakdown Below Support
If price fails to hold $149.14 and sellers take control, we pivot to a short strategy:
Price confirms a breakdown below $146.45, signaling further weakness.
First target: $141.51 – the previous absolute low, critical for buyers to step in.
Second target: New breakdown structure, where price searches for fresh demand zones.
Key Trade Setups Based on Ray Interactions
Bounce Long from $149.14 → Target $155.94: If price interacts with the ray and moving averages turn upward, this trade has strong risk-reward potential.
Breakout Trade Above $155.94 → Target $163.18: Needs clear volume confirmation—watch for aggressive buy-side flows.
Short Below $146.45 → Target $141.51: A clean break and close under this level confirms bearish sentiment.
Every move starts with interaction with a ray, and the price will continue from one ray to the next—that’s the core principle. The market map is set—are you ready to play it?
Your Move – Let’s Talk Trading!
Markets don’t lie—price respects structure, and now you’ve got the map. Check back later to see how price follows these rays and levels—because that’s the key to understanding real trading setups.
Got questions? Drop them in the comments! Let’s discuss the setups, confirm levels, and make sure everyone gets clarity. If this analysis helped you, hit Boost and save it—you’ll want to revisit this as price plays out.
My ray-based strategy maps everything automatically, but it’s available only in Private. If you’re interested in using it, DM me—I’ll explain how to get access.
Need analysis on a specific asset? I can chart anything. Some ideas I post publicly, others we can discuss privately if you want exclusivity. Just let me know what you need.
And if you want more high-precision market breakdowns, follow me here on TradingView—this is where I drop all the insights. Let’s trade smarter together! 🚀

$PEP as a potential anti-cyclical buying opportunityFor conservative anti-cyclical investors seeking annual returns in the 8-12% range, PepsiCo NASDAQ:PEP is becoming very interesting
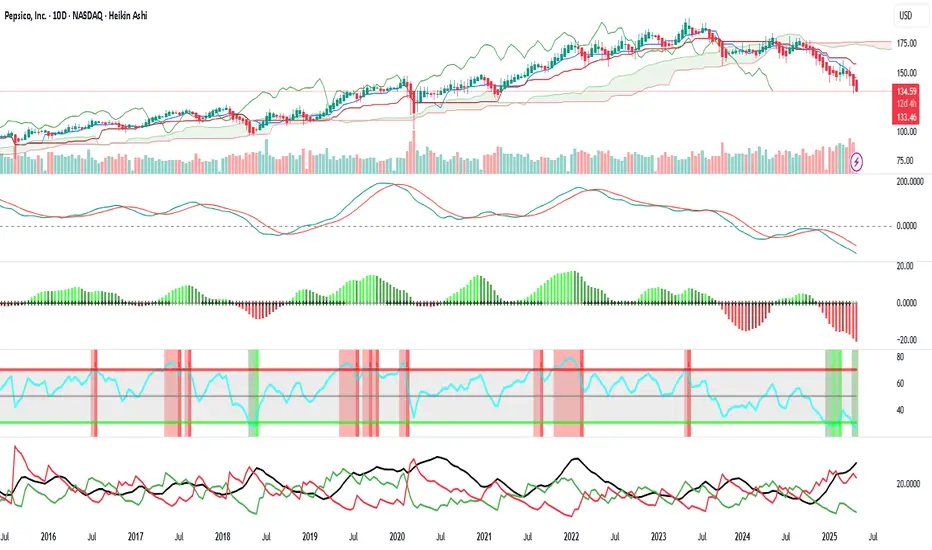
Bollinger Bands & RSI Signal (chart 1):
Late last week, the stock generated my favorite oversold signal at the weekly level
My personal Accumulation Strategy in three tranches:
- First Tranche: Buy at $144
- Second Tranche: Buy at $136 if price dips further
- Third Tranche: Consider buying at $132, supported by 2021 Order Block (Chart 2)
- Potential Crash Scenario: If a market crash occurs, I will buy at ~$110 for final position completion
Fundamental Insights (Chart 3):
- Current earnings yield: 4.7%; Dividend yield: 3.7%
- Dividend growth rate over last decade: 7.5% per year
- PE ratio around 21, low since the Rona crash
Reasons Recent Price Decline:
- Inflation impact: Consumers switching to cheaper alternatives
- USD Strength: Diminishing international profits
- Rising US Government Bond Yields: Competing with dividend stocks, though NASDAQ:TLT at 2007 Order Block support suggests possible reversal (Chart 4)
-> Political Influence:
- Trump's stance: High interest rates and inflation, aiming to address these issues could weaken USD, benefiting PepsiCo
Conclusion:
PepsiCo presents a compelling choice for steady, anti-cyclical investments, with technical support, dividend growth, and potential economic policy shifts

PepsiCo (PEP) Analysis
The price is approaching a strong support zone at $145–$150, which has acted as a key resistance in 2020 and a reliable support level during 2022–2023. This zone could trigger a bounce, but much will depend on the upcoming earnings report on February 4th. A positive report might drive a rebound toward $160 or higher, while disappointing results could lead to a breakdown toward $130. Monitor price action closely near the support zone and wait for bullish confirmation before making any moves!
