PINS trade ideas
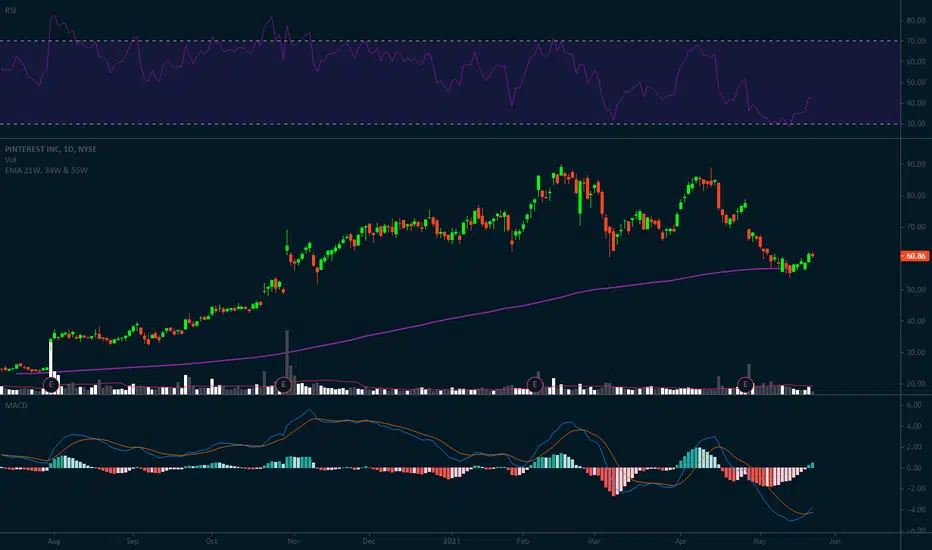
$PINS Update, Looking to fill the Gap Pinterest slowly but steadily making a comeback to fill that $76 gap, MACD reversing and respecting its support within the horizontal channel as predicted.

PINS Analysis $PINS
Price Target 73 🎯
Bump & Run Reversal ✅
3 Bar Play ✅
Break Above Clouds ✅
Trend Reversal ✅
Invalidated Below 60.38 ❌

break out $62 resistant? $pins if we brake up $62 resistant we will see prices between $65-$70
i am long


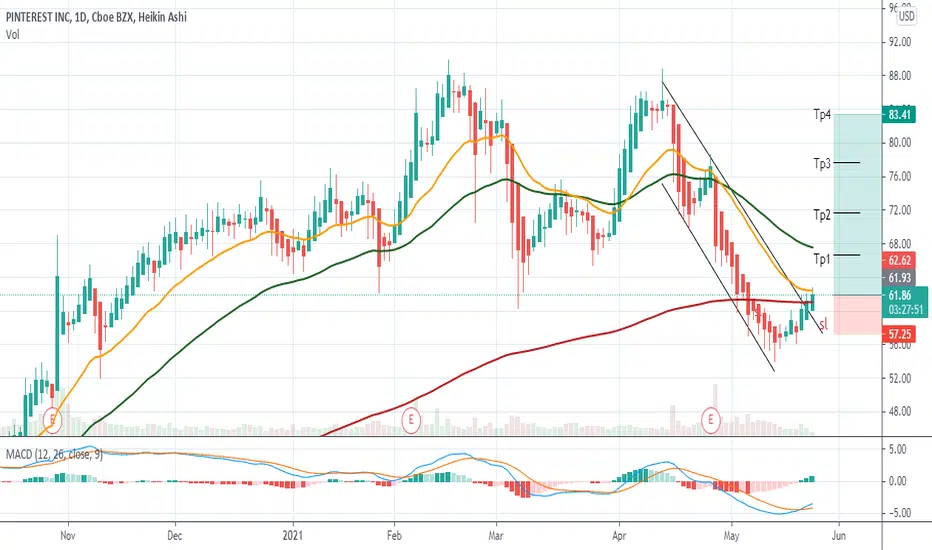
$PINS$PINS – I am posting this along side $SQ because the charts are nearly identical and I want to compare what happens in the future.
It appears to me to be a bearish corrective break – with the projections as charted.
The ‘W’ shape top appears to have been a double top reversal = price fell to 200 day EMA. This is also the bottom of the vol profile and the .380 fib level. A double top reversal measures the top and bottom wave to forecast a price below support. That is the range I will look for entry.
Because MACD and RSI are indicating oversold a bear flag is possible.
NYSE:PINS
NYSE:SQ

-21 mei 2021 trading analysis TRIP
-21 mei 2021
trading analysis TRIP
Disclaimer:
This information is for educational purposes and is not an investment recommendation or representative of professional expertise. This analysis used herein is for illustration purposes only. This personal opinion should not be considered specific investment advice. I am not responsible for any trades, and individuals are solely responsible for any live trades placed in their own personal accounts.
- - - - - - - - - - - - - - - - - - - - - - - - - - - - - - - - - - -
#keep learning bakkarianz metode


PINS Bullish Engulfing PatternPINS' chart has only seen a Bullish Engulfing (BE) pattern on 4 instances since it has gone public.
1) The first was at the beginning of January 2020 - the stock rallied from $18.88 to $27.10 by Feb 7th, 2020. (43.5% increase)
2) The second was at the end of March 2020 - the stock rallied from $14.92 to $21.59 by May 5th, 2020. (44.7% increase)
3) The third was on March 17th, 2021 - the stock rallied from $74.07 to $88.75 by April 14th, 2021. (19.8% increase)
4) The 4th one just happened on May 11th, 2021.
I think this is a great opportunity to buy PINS as it has shown quick returns (around a month's timeframe) in the past after a BE pattern has been demonstrated. RSI values are also sitting very low (which means the stock is oversold). The Stochastic RSI is also indicating oversold levels. All of these indicators tell us that this is a great time to buy PINS. Please ensure that you set your target sell prices and make sure to do your own due diligence first.

pinsI like it here. If we get a flush in the market and this goes sideways I'm buying and loading the MIL account up too.

Neckline break in PINSClassic double top & neckline break. The downside could be equal to the height above the neckline. So, this thing could slid to $45


Strong support area and round numberThe stock PINS declined over the days and finally came to the biggest support area which holds now EMA200 and SMA200. Both indicators are almost at the same place at the price $60. Stock holds $60 as its strong support area with EMA200 and SMA200. Keep an eye on if it holds then it can bounce back until $70 or $80. I'm going to open a long position to this stock with good risk/reward ratio!


Pins Low risk Butterfly pattern See chart for 1.272 extension, stop below 1.414 ext. Targeting 382, 618 , 1 of pattern

Pins multiple trade ideas 65 has held (until today) first trade is a gap fill and the second a fib retrace with a higher R/R

Long position on PinterestWell tested resistance met currently after earnings, I expect at least a short term recovery up to around the 50MA area of value at around $75 so this would be a good entry trigger.

