PLUN trade ideas

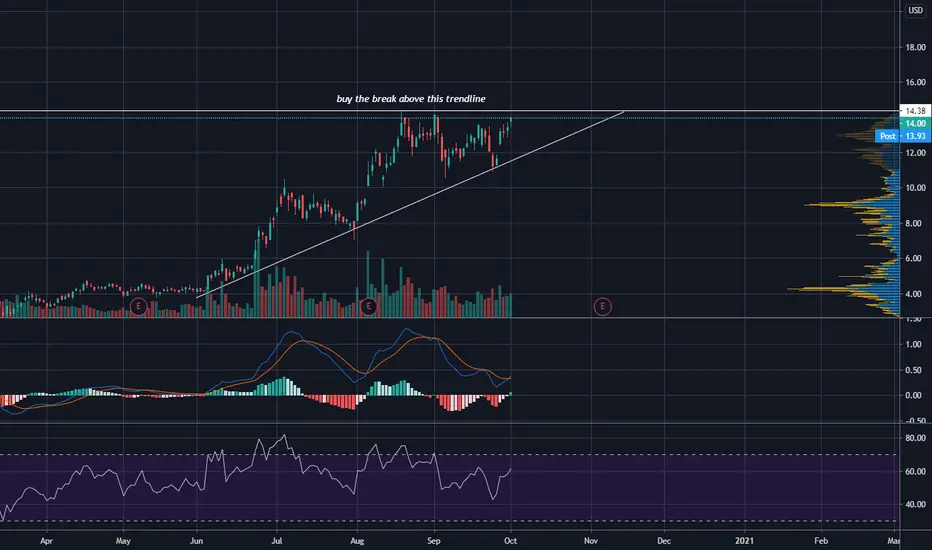
plug: buy the breakout of athsimple setup here, could be a big move if the spy doesnt start coming down again.
$PLUG Power Day Trade
MAC in bullish reversal
RSI breaking downtrend
Volume rising
Histogram ticking higher


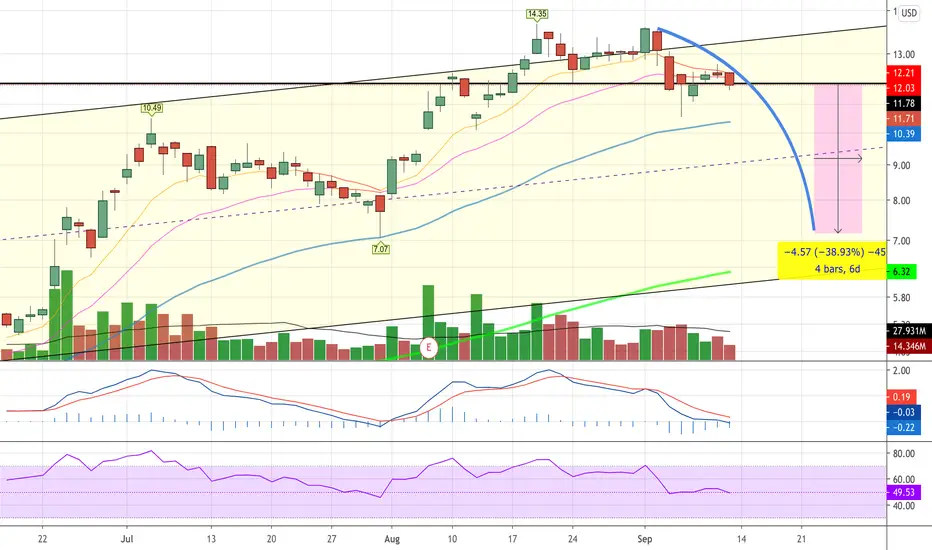
PLUG - Impulse to CorrectivePLUG has finished it's latest bull-run and is in the midst of a much larger correctional wave. Just my notes based off the wave-count I see.
There could be a minor ABC corrective wave that's already finished, for this reason the price point of invalidation is: 13.55
Looking for a pullback to the $10-$9 range.


Plug to 14!!! HooorayOn our way up.. Follow me.
I've been pretty accurate thus far. Of course do your own due diligence and make your own choices.
I'm not liable for your loses. feel free to compensate me with your gains.. :)

Plug is breaking records this week!! New Highs!!! $15-$16.xx Good Morning, I did this Friday but I decided to add some notes this time. Wanted to explain.. Plug Symposium is this Thursday. Massive volume in high demand until then.


PLUG Buy in last opportunity!!Cup and handle Bullish signal.. Do you onwn research before buying. I am liable to accept your gains, however I am not absolutely not liable for your losses.


Daily Wisdom 13 - Such is the marketO Captain! my Captain! our fearful trip is done,
The ship has weather’d every rack, the prize we sought is won,
The port is near, the bells I hear, the people all exulting,
While follow eyes the steady keel, the vessel grim and daring;
But O heart! heart! heart!
O the bleeding drops of red,
Where on the deck my Captain lies,
Fallen cold and dead.

Plug Power $Plug - Symmetrical TriangleLooks like it could range here for up to 3 weeks before continuing to go up. Some interest in NKLA post-warrants could see this push on here as well. Triangle resolution seems to match up with the Plug Symposium on 24 September.

PLUG POWER When Short Sellers Prepare Hitting?Plug Power Inc (PLUG)
Period Moving Average Percent Change
50-Day 9.23 +146.64%
100-Day 6.78 +277.94%
200-Day 5.27 +383.08%
Year-to-Date 5.71 +306.65%

The 8-Day EMANASDAQ:PLUG
strategy: swing, trend follow
timeframe: daily, weekly
entry point: price crosses or stayed above the 8-day EMA; Stochastic = not overbought; price bounces off from support.
monitoring: stay long as long as the price is above the EMA line
exit point: close the position when price hits resistance or when the price crosses down the EMA line.


Update to PLUG retracement from wave 3 to wave 4slightly updated chart showing wave 3 to wave 4 retracement
