PLTR LEVELS ENDING MARCHI like PLTR of course.
Buy every dip??? or hold off to certain price point?
Again
DCA METHOD, aggressive but safe (Making up for lost time since covid when i started and stopped)
PTX trade ideas
Opening (IRA): PLTR May 16th 90 Covered Call... for a 76.56 debit.
Comments: After taking off my iron condor for a loss, structuring a covered call such that the max profit potential is greater than the loss experienced by the nondirectional of 13.11.
Metrics:
Buying Power Effect/Break Even: 76.56
Max Profit: 13.44
ROC at Max: 17.55%
Will generally look to roll out the short call out and/or down and out at intervals to increase profit potential and/or reduce downside break even ... .

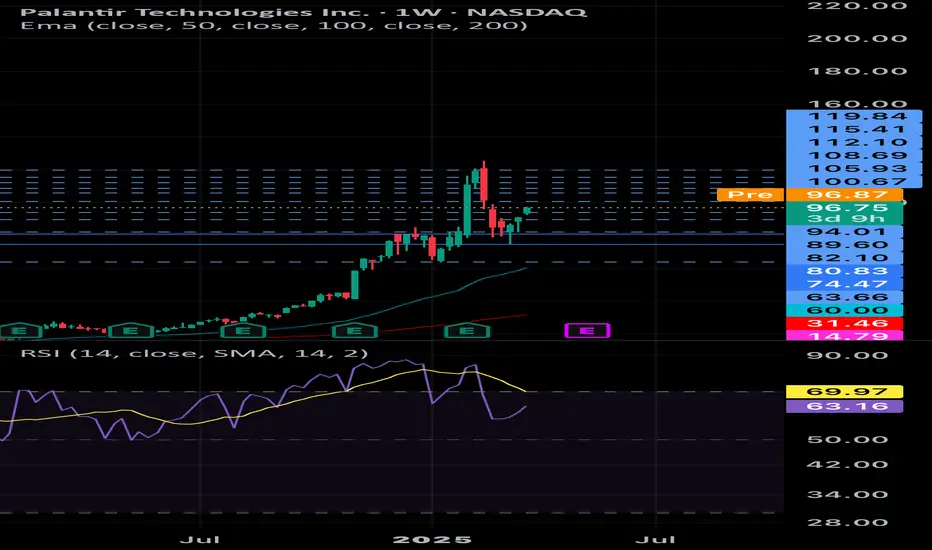
PLTR LONGLong calls. New higher low on the weekly after finishing the sell off. Holding for new Highs. i’m expecting all of the volume that was sold during the sale will be put back into the market with the additional gains from the sale.looking for $120 to become the new support. Holding until further notice.
PLTR Approaching Critical Gamma Level! Reversal or Continuation?Here's an in-depth update on PLTR based on the current 1-hour chart and Gamma Exposure insights.
📈 Technical Analysis (TA):
* Current Price Action: PLTR is trading around $96 after a strong bullish move. It is currently consolidating within a green reversal zone, suggesting caution for possible short-term reversals.
* Immediate Resistance: The significant gamma resistance (Gamma Wall) is located at $100, which could act as a strong magnet for price action but also a tough barrier for bulls.
* Support Levels: Strong support and reversal (red) zone detected around $86, marking an important area for potential bullish continuation if tested again.
* Reversal Zones: Price is currently inside the green reversal zone (around $95–$97). Watch closely for signs of weakening momentum or rejection, signaling a possible pullback.
📊 GEX & Options Insights:
* Gamma Resistance: Highest positive NET GEX at $100, creating a strong overhead resistance and potential magnet level for bullish scenarios.
* Gamma Support: Put support relatively low with notable strength at $75, indicating significant downside protection.
* IVR (Implied Volatility Rank): Moderately high at 52%, suggesting elevated premiums—favorable conditions for credit spreads or cautious long options plays.
* CALL Dominance: Calls at 42.6% indicate a relatively balanced yet slightly bullish market sentiment.
💡 Trade Recommendations:
* Bullish Scenario: Watch for a sustained breakout above the $97 resistance area targeting the key $100 Gamma Wall. Place a conservative stop-loss around $94.
* Bearish Scenario: Consider bearish strategies (puts or credit call spreads) if a strong rejection from the current green reversal zone occurs, targeting downside levels near $90–$86.
* Neutral/Range Scenario: Ideal conditions to implement neutral options strategies like iron condors or credit spreads between $85 and $100 given the elevated implied volatility.
🛑 Risk Management:
* Given PLTR's elevated volatility and proximity to reversal zones, tight risk management with clear stops is essential.
Trade wisely and responsibly!
Disclaimer: This analysis is for educational purposes only and does not constitute financial advice. Always perform your own research and manage your risk appropriately.

Pullback in Palantir Palantir Technologies had a dramatic rally in recent months, and now traders may see an opportunity in its latest pullback.
The first pattern on today’s chart is the 50-day simple moving average (SMA). While many other stocks, like Apple and Microsoft, have plunged below their 200-day SMAs, PLTR ended last week above its 50-day SMA. That may reflect relative strength versus the broader market.
Second, prices made a lower low and higher high on Friday. That kind of outside candle is a potentially bullish reversal pattern.
Third, the software company just had its highest weekly close since February 21.
Next, some short-term indicators may be positive: MACD is rising and the 8-day exponential moving average (EMA) is nearing a potential cross above the 21-day EMA.
Finally, PLTR is one of the top underliers in the options market. (Its 800,000 contracts per day in the last month ranks it fourth in the S&P 500, according to TradeStation data.) That could help traders take positions with calls and puts.
TradeStation has, for decades, advanced the trading industry, providing access to stocks, options and futures. If you're born to trade, we could be for you. See our Overview for more.
Past performance, whether actual or indicated by historical tests of strategies, is no guarantee of future performance or success. There is a possibility that you may sustain a loss equal to or greater than your entire investment regardless of which asset class you trade (equities, options or futures); therefore, you should not invest or risk money that you cannot afford to lose. Online trading is not suitable for all investors. View the document titled Characteristics and Risks of Standardized Options at www.TradeStation.com . Before trading any asset class, customers must read the relevant risk disclosure statements on www.TradeStation.com . System access and trade placement and execution may be delayed or fail due to market volatility and volume, quote delays, system and software errors, Internet traffic, outages and other factors.
Securities and futures trading is offered to self-directed customers by TradeStation Securities, Inc., a broker-dealer registered with the Securities and Exchange Commission and a futures commission merchant licensed with the Commodity Futures Trading Commission). TradeStation Securities is a member of the Financial Industry Regulatory Authority, the National Futures Association, and a number of exchanges.
Options trading is not suitable for all investors. Your TradeStation Securities’ account application to trade options will be considered and approved or disapproved based on all relevant factors, including your trading experience. See www.TradeStation.com . Visit www.TradeStation.com for full details on the costs and fees associated with options.
Margin trading involves risks, and it is important that you fully understand those risks before trading on margin. The Margin Disclosure Statement outlines many of those risks, including that you can lose more funds than you deposit in your margin account; your brokerage firm can force the sale of securities in your account; your brokerage firm can sell your securities without contacting you; and you are not entitled to an extension of time on a margin call. Review the Margin Disclosure Statement at www.TradeStation.com .
TradeStation Securities, Inc. and TradeStation Technologies, Inc. are each wholly owned subsidiaries of TradeStation Group, Inc., both operating, and providing products and services, under the TradeStation brand and trademark. When applying for, or purchasing, accounts, subscriptions, products and services, it is important that you know which company you will be dealing with. Visit www.TradeStation.com for further important information explaining what this means.

Go Long on PLTR: Strategic Restructuring Signals Growth Potentia
-Key Insights: Palantir Technologies is undergoing significant strategic
restructuring, particularly within its government business segment. This move
enhances its operational efficacy and positions it for potential market
expansion. The company's proactive approach in adapting to changes indicates
robust regenerative growth capabilities. Investors should remain optimistic
about its long-term value due to these strategic initiatives.
-Price Targets:
-Next Week Targets: T1 = $93.69, T2 = $95.45
-Stop Levels: S1 = $88.67, S2 = $87.20
-Recent Performance: Palantir has witnessed fluctuations but maintains a strong
foothold due to strategic positives. Restructuring has led to an operational
realignment, which although resulted in an 8% segment reduction, conveys greater
profitability potential. Despite recent dips, these strategic decisions have
fortified investor confidence in the company's projected trajectory.
-Expert Analysis: Analysts align Palantir's potential growth with that of tech
giants like Tesla, driven by favorable market and regulatory conditions. The
strategic restructuring is seen as a smart maneuver, enhancing the firm’s
competitive advantage in both public and private sectors, and prepares it for
tapping into emerging opportunities.
-News Impact: Palantir's upcoming Q3 earnings report has attracted significant
attention, especially following announcements of major deals set to boost
revenue streams. These partnerships showcase Palantir's adeptness at recognizing
and leveraging profitable opportunities, reinforcing its market dominance.
Investors should closely monitor these developments, as they will likely
influence PLTR's financial health and investment appeal.

alerted at 83 still going strong based on indicatorsEntering week 2, we are still on course and have a target to hit 100. Oversold areas, oscillators reboot.

PLTR if it breaks trend it will be an interesting junctureIf PLTR breaks the trend will reach 45. But at that point it
1) Fills the gap of Nov 24
2) will be 2021 high
When a (strong) trendline is broken, the market will fall equal distance or more from the trendline as from the peak to the breakpoint. I have shown multiple example on Nasdaq from the past.

PLTR) Approaching Critical Resistance – Will Bulls Push Through?Technical Analysis & Options Outlook
📌 Current Price: $87.00
📌 Trend: Bullish Momentum with Key Resistance Zone
📌 Timeframe: 1-Hour
Price Action & Market Structure
1. Bullish Trend Holding – PLTR has maintained higher lows and is now testing a critical resistance zone near $88–$90.
2. Breakout Setup Forming – Price is pressing against a descending trendline. A clean breakout above $88–$89 could trigger a sharp move higher.
3. Potential Pullback Before Breakout – If PLTR fails to hold above $86, expect a retest of the $84 support zone before another attempt.
4. MACD & Stoch RSI – Indicating bullish momentum, but nearing overbought conditions, which could lead to consolidation before continuation.
Key Levels to Watch
📍 Immediate Resistance:
🔹 $88 – First breakout level
🔹 $90 – Major CALL Resistance & Gamma Wall (60.92%)
🔹 $93.62 – Final breakout confirmation zone
📍 Immediate Support:
🔻 $84 – Breakout Retest Zone
🔻 $80 – Strongest PUT Support (-42.56%)
🔻 $75 – Secondary PUT Wall (-27.48%)
Options Flow & GEX Sentiment
* IVR: 61.8 (High Implied Volatility, favoring larger moves)
* IVx: 73.5 (-7.21%) (Volatility cooling down, setting up for a breakout)
* GEX (Gamma Exposure): Bullish Setup Forming ✅ ✅ ✅
* CALL Walls: $90 & $93.62 (Upside resistance zones)
* PUT Walls: $80 & $75 (High liquidity areas for demand)
📌 Options Insight:
* Above $88, expect a gamma squeeze toward $90–$93.62 if momentum holds.
* Below $86, risk increases for a pullback to $84–$80, where liquidity is highest.
My Thoughts & Trade Recommendation
🚀 Bullish Case: If PLTR breaks and holds above $88, expect a push to $90–$93.62.
⚠️ Bearish Case: If PLTR fails at $88, a pullback to $84 or even $80 is likely before another move up.
Trade Idea (For Educational Purposes)
📌 Bullish Play:
🔹 Entry: Breakout above $88
🔹 Target: $90–$93.62
🔹 Stop Loss: Below $86
📌 Bearish Play (Hedge Idea):
🔻 Entry: Rejection at $88
🔻 Target: $84–$80 PUT Wall
🔻 Stop Loss: Above $89
Disclaimer
This analysis is for educational purposes only and does not constitute financial advice. Always perform your own research and manage risk accordingly.
Final Thoughts
PLTR is at a major breakout level near $88. A successful breakout could push it to $90+, while failure could lead to a pullback toward $84 or $80. Watch price action carefully and wait for confirmation before entering a trade.

POTENTION MOVE FOR PALANTIR TECHNOLOGIES INCHi everyone, this is Palantir analysis as we can see that there is a potential move to the upside, from one day time frame we see a good market structure in bull perspective just like yesterday can in one daily time we see a hummer candlestick though there is a gap in downside so be carefully

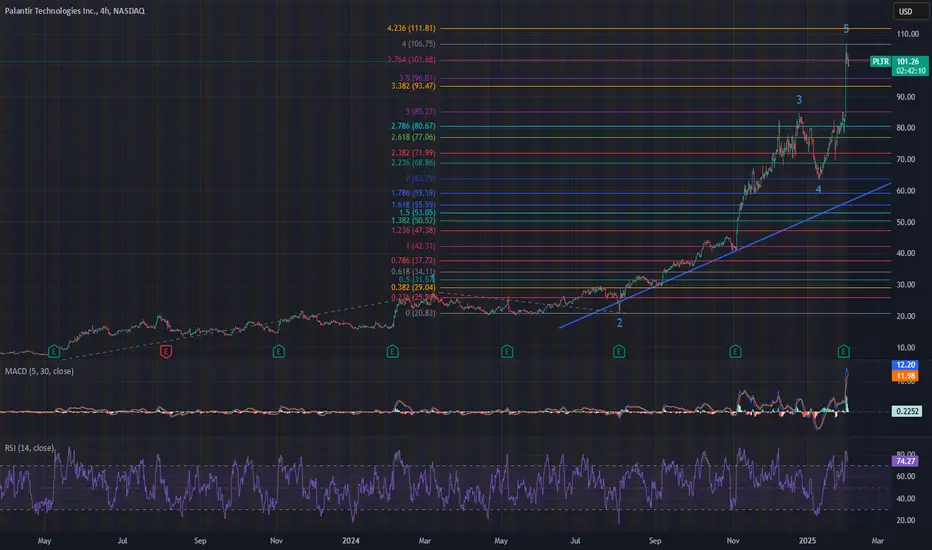
Palantir - learning to fly (wave & fib analysis)Just a quick lock at PLTR price development.
This fits quite well into a 5-wave move and the fibonacci extensions.
After earnings price hit the 4.0 extension with astonishing precision, but this can be seen quite often with other stocks like AMD as well.
Price is currently trading around the 3.764 extension and at a P/E (ttm) of just 534.
This will probably last for some time, but buying here is obviously not a good idea.
A retracement back to the trendline in the 70$ area wouldn't surprise me.
What goes up must come down.
Go Long on PLTR: Strong Fundamentals and Strategic Growth
-Key Insights: Palantir Technologies is capitalizing on its AI capabilities and
strategic partnerships to strengthen its market position, especially through
government contracts and expansions in the healthcare sector. These moves ensure
its resilience amidst defense budget scrutiny and market volatility.
-Price Targets: For next week, considering the bullish sentiment, here are the
suggested targets and stop levels:
- T1: $90.00
- T2: $92.00
- S1: $84.80
- S2: $83.17
-Recent Performance: PLTR has shown robust performance, benefiting from new
partnerships and increased investor confidence. Its stock has appreciated
significantly, cementing its status among leading AI-driven tech firms.
-Expert Analysis: Market analysts view Palantir's potential positively. Despite
its high P/E ratio, the company's strategic growth in AI and defense-related
sectors portrays it as a promising long-term investment, aided by strong
alliances with firms like Booz Allen Hamilton and AWS.
-News Impact: The partnership with R1 in the healthcare sector reflects
Palantir's strategic diversification. This development not only mitigates
potential risks from defense budget cuts but also showcases the company's
ability to drive operational improvements across various industries, further
strengthening its growth outlook.
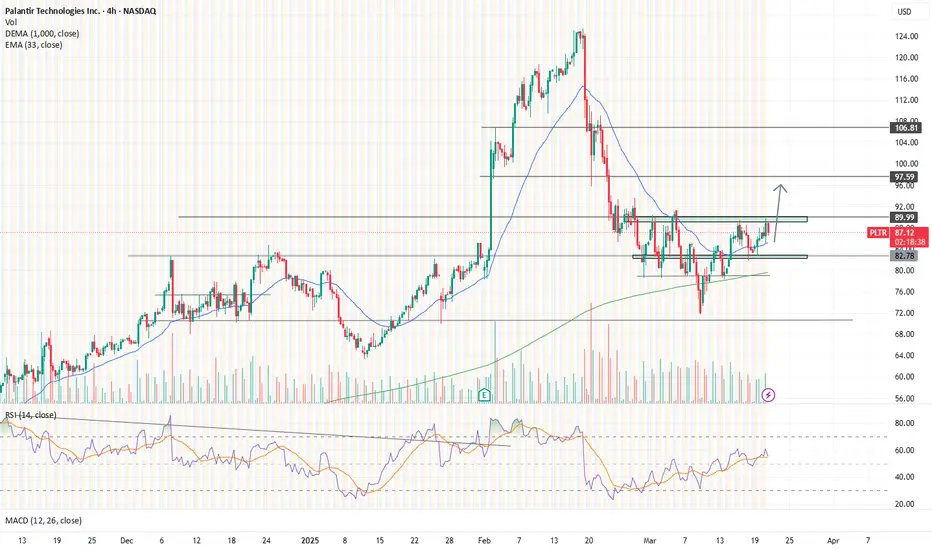
PLTR at Major Resistance! Breakout or Pullback Ahead? Mar17Quick look at PLTR’s current setup on the 4-hour chart.
📈 Technical Analysis (TA):
* PLTR is testing critical resistance within a descending channel around $86-$90; important decision point here.
* Recent Change of Character (CHoCh) hints bullish momentum might be picking up.
* Watch carefully the $90.94 level for breakout confirmation.
* Strong support clearly established at recent BOS level around $71.81–$78.45. Crucial floor if price retraces.
* Significant overhead resistance near $125 if a strong breakout occurs.
📊 GEX & Options Insights:
* Strong positive NET GEX and CALL resistance at $100; key gamma level to watch for potential moves.
* Robust PUT support clearly marked at $70; strong floor for downside protection.
* IV Rank extremely high at 74.2%; premiums rich and ideal for selling options or using defined-risk spreads.
* CALL ratio at 44.3%, suggesting mixed sentiment, slightly leaning bearish.
💡 Trade Recommendations:
* Bullish Play: Confirm breakout above $90.94 before entering calls, targeting up toward $100 gamma wall initially. Keep stops just under $85.
* Bearish Play: Watch for a strong rejection at current resistance levels; consider puts back toward $78 and potentially lower.
* Neutral setups: High IV makes Iron Condors or premium collection strategies attractive between clear levels ($70–$100).
🛑 Risk Management: With elevated volatility, tight stop-losses and careful position sizing are essential.
Stay sharp, traders!
Disclaimer: This analysis is for educational purposes only and does not constitute financial advice. Always do your own research and manage your risk before trading.

A Bounce For Palantir?Granted that tech stocks are clearly hostage to macro at present (Trump v. Powell), a few are poised to rebound strongly should events permit. Palantir is one of them.
With support above the 50% of the move from the 8/5 low to the ATH, with good fundamentals, and a narrative that remains compelling (AI), Palantir may well continue its run if the results of next week's FOMC meeting are at all tolerable to equities markets.
Palantir has today broken the regression from the ATH to the Lower Low 3/10. Where stochastics stand, I can see a brief pullback to the low 80s Monday followed by a strong end of week. A daily close above 91--or, better yet, 98--would confirm for me Palantir's return to price discovery.
Any buys in the low 80's, I'd stop just under the 50% (at about 72).

PLTRPLTR
Elliott wave chart
It appears to me from the chart that the rise has not ended yet and there is an upcoming rise to higher targets

PLTR market favourite- price prediction based on VP $45Everybody loves PLTR and wants a bite of it. I dont love any stocks. I only love market profile tool which keeps me sane. Good news is, you maybe able to buy PLTR at 45. No, this is not me saying, I am just an interpreter of Volume profile. Act at your own risk

PLTR to 100 to fill the gapPLTR to 100 to fill the gap then will fall back again to the trend line or lower .Its too early to head any higher. The wild party just got over, got to wait for the hangover to get over before the next party. It needs to consolidate and find its solid feet around 70-80

PLTR Testing Key Levels! Is This the Reversal We've Been WaitingMarket Structure Overview
* Downtrend continuation observed with rejection at the Reversal Zone.
* Price is currently consolidating just below the downward trendline, struggling to break out.
* Volume suggests buyers are stepping in, but not convincingly enough for a strong reversal.
Key Support & Resistance Levels
* Support Zones:
* $78.00 – Psychological support and highest negative NETGEX level.
* $75.00 - $70.00 – Put wall zone, potential last strong support before further downside.
* Resistance Levels:
* $80.00 - $82.00 – Key breakout zone from the current wedge.
* $88.00 - $90.00 – Major resistance from the 2nd CALL Wall.
* $95.00 - $100.00 – Strong Gamma Wall and CALL resistance.
Indicators & Momentum
* MACD: Trying to cross bullish but lacks momentum—still in negative territory.
* Stoch RSI: Near oversold and pointing upwards—short-term bullish impulse possible.
* Volume: Increased slightly, but not confirming a breakout yet.
GEX & Options Insights
* PUT Support: Strongest negative NETGEX level near $78.00, showing that options market expects support here.
* CALL Resistance: Highest concentration between $88.00 - $100.00, suggesting a tough breakout level.
* IVR: 99.4, indicating high implied volatility.
* Options Flow: Calls at 18.1%, slightly bullish but still mixed sentiment.
Potential Trade Setups
* Bullish Case:
* Entry: Above $82.00 with confirmation of strength.
* Target: $88.00 - $90.00 for the first target, $100.00 for aggressive move.
* Stop Loss: Below $78.00 to cut losses early.
* Bearish Case:
* Entry: Rejection at $80.00 - $82.00 and failure to break trendline.
* Target: $75.00, then $70.00 if downside continues.
* Stop Loss: Above $85.00 if momentum shifts bullish.
📌 Final Thoughts:
PLTR is at a critical juncture—a breakout above $82.00 could trigger a bullish reversal, but failure to hold $78.00 might bring further downside. Keep an eye on volume and momentum shifts for confirmation.
📢 This analysis is for educational purposes only and does not constitute financial advice. Always manage your risk before trading.

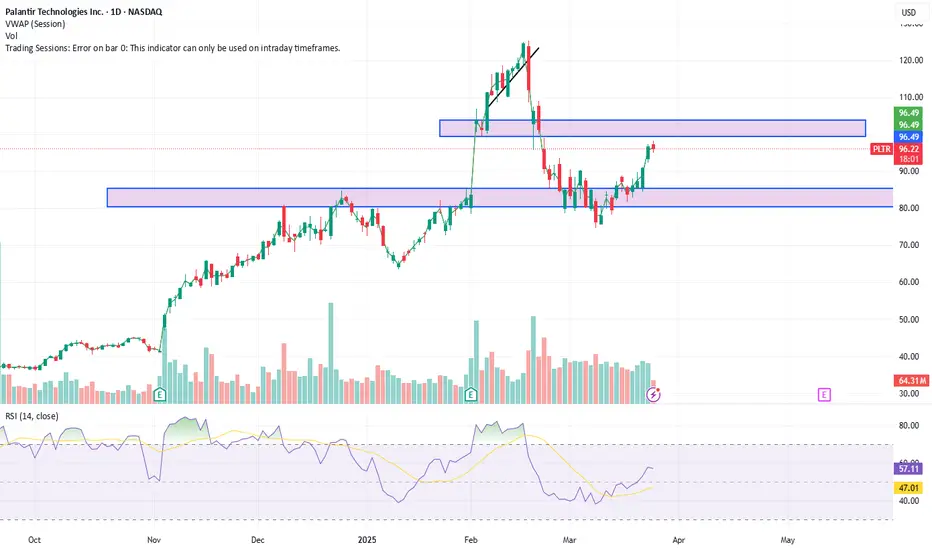
PalantirNo change to my analysis. I am expecting price to move higher towards the 0.382 @96.47 for sub-minuette a of minor B. We don't yet have confirmation though so could technically still be the minor A wave of (4). Don't forget my turquoise count suggests that wave (4) is already over, and we're heading higher in (5). I still find this count not very likely due to the structure of how we moved off the recent bottom on 28 Feb.
In short, my primary is that we're currently in wave B with a final target of $107-$118 or even slightly higher to form a flat abc. Secondary is we need a slight low to complete minor A. Third possible outcome is that wave (4) is already over, and we've begun (5) already. Notice that every pattern I am tracking has either bottomed or is extremely close. We should be headed to the upside in very short order, if not tomorrow. MACD and RSI both support this. Let me know if my expectations are unclear.

Palantir Technologies (PLTR) - Technical & Options AnalysisMarket Structure & Price Action
* PLTR is currently trading at $84.82, showing signs of a potential reversal from a previous downtrend.
* The stock found support around $78.58, aligning with a previously identified reversal zone.
* There is early bullish detection as price has broken above the descending channel, potentially signaling a shift in trend.
* Resistance at $90.97 is a key level to watch for a continued move higher.
Supply & Demand Zones
* Support Zone: $78 - $80 (Reversal zone, where buying pressure emerged)
* Resistance Zone: $85 - $92 (Potential rejection or breakout zone)
* Higher Target Zone: $100 - $105 if the bullish momentum continues
Indicator Analysis
* MACD: Showing bullish momentum, but histogram bars are flattening, suggesting consolidation before the next move.
* Stochastic RSI: Overbought levels indicate potential short-term pullback before further upside.
Options Flow & Gamma Exposure (GEX)
* Call Walls: $100 (72.6%) and $105 (55.18%) indicate where significant call option resistance might occur.
* Put Walls: $75 (-47.11%) and $70 (-99.54%) suggest strong put positioning at these levels.
* IV Rank: 87.4, indicating elevated implied volatility, meaning options premiums are high.
* Options Sentiment: 24.1% call positioning suggests a slight bullish sentiment, but caution is warranted.
Trade Scenarios
Bullish Case:
* Entry: Above $85.50
* Target: $90 - $92, with extended upside to $100 - $105
* Stop-loss: Below $82
Bearish Case:
* Entry: Below $82
* Target: $78 - $75
* Stop-loss: Above $85
Conclusion
* PLTR is showing early bullish signs, but confirmation is needed with a sustained move above $85.
* Watch for a potential retest of support before a breakout.
* Options data suggests strong resistance around $100 - $105, making it a key decision point for further upside.
Disclaimer: This analysis is for educational purposes only and does not constitute financial advice. Always conduct your own due diligence before making trading decisions.

Only the technically strong will surviveAfter a wild 3 weeks of selling, one thing is for sure. If you dont have strong technical analysis skills, you might want to step aside.

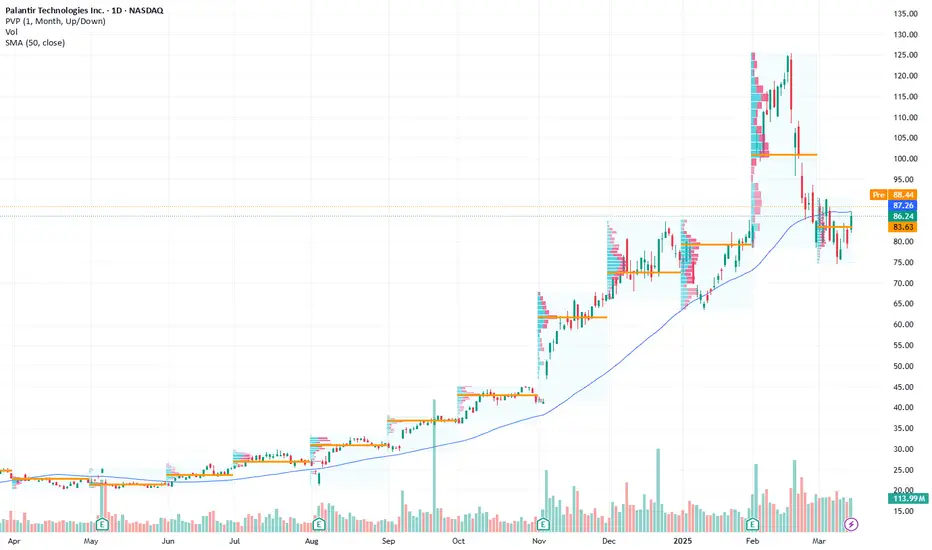
Palantir’s Uptrend May Be at RiskPalantir Technologies has climbed steadily since the summer, but some traders may think the run is nearing an end.
The first pattern on today’s chart is the series of higher lows since early August. The software company is now under that line, which may suggest its uptrend is at risk.
Second, PLTR has made lower highs while holding its February 3 low of $78.47. That descending triangle is potentially bearish.
Third, prices have failed to hold the 50-day simple moving average. Is its intermediate-term direction changing?
Fourth, the 8-day exponential moving average (EMA) is below the 21-day EMA. Prices also hit resistance at the 8-day EMA yesterday and MACD is dropping. Those patterns may be consistent with a short-term downtrend.
Finally, PLTR is one of the most active underliers in the options market. (It’s averaged about 1.3 million contracts per day in the last month, according to TradeStation data.) That could make some traders look to position for moves with calls and puts.
TradeStation has, for decades, advanced the trading industry, providing access to stocks, options and futures. If you're born to trade, we could be for you. See our Overview for more.
Past performance, whether actual or indicated by historical tests of strategies, is no guarantee of future performance or success. There is a possibility that you may sustain a loss equal to or greater than your entire investment regardless of which asset class you trade (equities, options or futures); therefore, you should not invest or risk money that you cannot afford to lose. Online trading is not suitable for all investors. View the document titled Characteristics and Risks of Standardized Options at www.TradeStation.com . Before trading any asset class, customers must read the relevant risk disclosure statements on www.TradeStation.com . System access and trade placement and execution may be delayed or fail due to market volatility and volume, quote delays, system and software errors, Internet traffic, outages and other factors.
Securities and futures trading is offered to self-directed customers by TradeStation Securities, Inc., a broker-dealer registered with the Securities and Exchange Commission and a futures commission merchant licensed with the Commodity Futures Trading Commission). TradeStation Securities is a member of the Financial Industry Regulatory Authority, the National Futures Association, and a number of exchanges.
Options trading is not suitable for all investors. Your TradeStation Securities’ account application to trade options will be considered and approved or disapproved based on all relevant factors, including your trading experience. See www.TradeStation.com . Visit www.TradeStation.com for full details on the costs and fees associated with options.
Margin trading involves risks, and it is important that you fully understand those risks before trading on margin. The Margin Disclosure Statement outlines many of those risks, including that you can lose more funds than you deposit in your margin account; your brokerage firm can force the sale of securities in your account; your brokerage firm can sell your securities without contacting you; and you are not entitled to an extension of time on a margin call. Review the Margin Disclosure Statement at www.TradeStation.com .
TradeStation Securities, Inc. and TradeStation Technologies, Inc. are each wholly owned subsidiaries of TradeStation Group, Inc., both operating, and providing products and services, under the TradeStation brand and trademark. When applying for, or purchasing, accounts, subscriptions, products and services, it is important that you know which company you will be dealing with. Visit www.TradeStation.com for further important information explaining what this means.
