SCL trade ideas
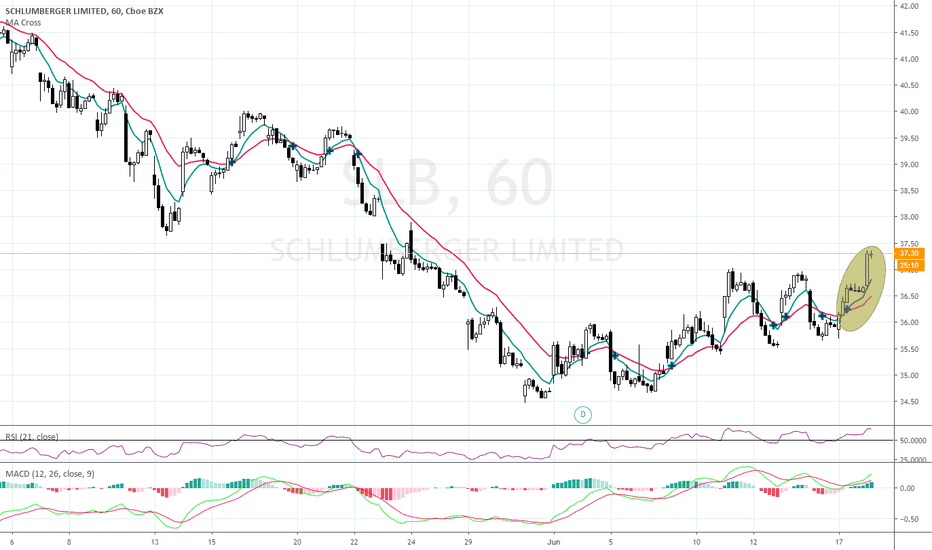
$SLB Buyers jump into SchlumbergerPossible entry on break out from channel @ $38 with $48 upside very achievable.
the bottom may be in at last for this sector, this week has seen very nice volume and advances even as Oil prices have dropped and many downgrades have issued.
Average analysts price target $42.53 | Overweight
Company profile
Schlumberger NV engages in the provision of technology for reservoir characterization, drilling, production and processing to the oil and gas industry. It operates through the following business segments: Reservoir Characterization, Drilling, Production, Cameron and Elimination and other. The Reservoir Characterization Group segment consists of the principal technologies involved in finding and defining hydrocarbon resources. The Drilling Group segment includes the drilling and positioning of oil and gas wells such as bits and drilling tolls, drilling and measurement, land rigs and integrated drilling services. The Production Group segment provides technologies in the lifetime production of oil and gas reservoirs such as well services, completions, artificial lift, well intervention, water service, integrated production services and others. The Cameron Group segment consists of the pressure and flow control for drilling and intervention rigs, oil and gas wells and production facilities. The company was founded by Conrad Schlumberger and Marcel Schlumberger in 1926 and is headquartered in Houston, TX.
$SLB The bottom may be in Schlumberger Possible entry level @ $33 with $39 target price at major resistance.
Chart has formed a bullish bottom and volume has had a considerable increase.
RSI bullish as is MACD cross with Histogram ticking higher & green.
Average analysts price target $42.57 | Overweight
Company profile
Schlumberger NV engages in the provision of technology for reservoir characterization, drilling, production and processing to the oil and gas industry. It operates through the following business segments: Reservoir Characterization, Drilling, Production, Cameron and Elimination and other. The Reservoir Characterization Group segment consists of the principal technologies involved in finding and defining hydrocarbon resources. The Drilling Group segment includes the drilling and positioning of oil and gas wells such as bits and drilling tolls, drilling and measurement, land rigs and integrated drilling services. The Production Group segment provides technologies in the lifetime production of oil and gas reservoirs such as well services, completions, artificial lift, well intervention, water service, integrated production services and others. The Cameron Group segment consists of the pressure and flow control for drilling and intervention rigs, oil and gas wells and production facilities. The company was founded by Conrad Schlumberger and Marcel Schlumberger in 1926 and is headquartered in Houston.
Schlumberger update inverse H&SMarket cap in S&P500 is 52.22B. Company supplies technology for drilling, production and processing in oil and gas industry.
Major banks and investment funds expect the price to go back above the $50 level. As many oil and gas companies, this stock had a bad year after the sell off in oil at the end of 2018. Now as oil seems to be recovering and uncertainty in Middle East puts supply into question, this stock could bounce.
On the technical side price reached a weekly trend line (see in the comments). Daily chart shows a potential inverse head and shoulders pattern forming. Divergence on indicators is present. Another pullback from the 200SMA before we spike. That would offer the best risk-reward trade. Increase in volume on spike to the upside would be first confirmation, then of course the break of red resistance zone and 200SMA.
Good Luck!
Schlumberger surges despite downgrade. The energy sector is a major benefactor from the rotation out of tech in recent days, as optimism over trade and dwindling recession fears has put the spotlight on this beaten down energy sector. Our bullish bias on SLB is confirmed by the fact it was able to shrug of a downgrade and post a gain for the day on Monday.
Schlumberger NV engages in the provision of technology for reservoir characterization, drilling, production and processing to the oil and gas industry. It operates through the following business segments: Reservoir Characterization, Drilling, Production, Cameron and Elimination and other. The Reservoir Characterization Group segment consists of the principal technologies involved in finding and defining hydrocarbon resources. The Drilling Group segment includes the drilling and positioning of oil and gas wells such as bits and drilling tolls, drilling and measurement, land rigs and integrated drilling services. The Production Group segment provides technologies in the lifetime production of oil and gas reservoirs such as well services, completions, artificial lift, well intervention, water service, integrated production services and others. The Cameron Group segment consists of the pressure and flow control for drilling and intervention rigs, oil and gas wells and production facilities. The company was founded by Conrad Schlumberger and Marcel Schlumberger in 1926 and is headquartered in Houston, TX.
$SLB earnings beat fails to impress investorsDespite naming a new CEO and a consistent earnings beat the selling continues as the bears remain in full control. Technically the chart is bearish and sentiment in the sector shows no signs of improvement.
NYSE:SLB met expectations for 35 cents per share in its Q2 earnings report, while $8.27 billion in revenues beat estimates by 1.9%. Like with AmEx, Schlumberger has now posted a positive surprise in three of the last four quarters.
AVERAGE ANALYSTS PRICE TARGET $48
AVERAGE ANALYSTS RECOMMENDATION OVERWEIGHT
P/E RATIO 50
SHORT INTEREST 11%
COMPANY PROFILE
Schlumberger NV engages in the provision of technology for reservoir characterization, drilling, production and processing to the oil and gas industry. It operates through the following business segments: Reservoir Characterization, Drilling, Production, Cameron and Elimination and other. The Reservoir Characterization Group segment consists of the principal technologies involved in finding and defining hydrocarbon resources. The Drilling Group segment includes the drilling and positioning of oil and gas wells such as bits and drilling tolls, drilling and measurement, land rigs and integrated drilling services. The Production Group segment provides technologies in the lifetime production of oil and gas reservoirs such as well services, completions, artificial lift, well intervention, water service, integrated production services and others. The Cameron Group segment consists of the pressure and flow control for drilling and intervention rigs, oil and gas wells and production facilities. The company was founded by Conrad Schlumberger and Marcel Schlumberger in 1926 and is headquartered in
$SLB UPGRADE FROM HOLD TO BUY FOR SCHLUMBERGERSeems like a highly unusual upgrade as the stock is teetering on the edge of another decline as support is tested. The Stifel analysts Stephen Gengaro has based his price target on the free cash floe generation, and thinks that it has a very compelling risk/reward for investors at these levels. He also reminds investors of the safe $2.00 dividend and that you get paid to wait, but for how long?, the stock is sitting on a support level that if it fails there is nothing below to stop the decline, there may be a good opportunity for a trade in the days to come on the long or short side.
AVERAGE ANALYSTS PRICE TARGET $51
AVERAGE ANALYSTS RECOMMENDATION OVERWEIGHT
P/E RATIO 24
COMPANY PROFILE
Schlumberger NV engages in the provision of technology for reservoir characterization, drilling, production and processing to the oil and gas industry. It operates through the following business segments: Reservoir Characterization, Drilling, Production, Cameron and Elimination and other. The Reservoir Characterization Group segment consists of the principal technologies involved in finding and defining hydrocarbon resources. The Drilling Group segment includes the drilling and positioning of oil and gas wells such as bits and drilling tolls, drilling and measurement, land rigs and integrated drilling services. The Production Group segment provides technologies in the lifetime production of oil and gas reservoirs such as well services, completions, artificial lift, well intervention, water service, integrated production services and others. The Cameron Group segment consists of the pressure and flow control for drilling and intervention rigs, oil and gas wells and production facilities. The company was founded by Conrad Schlumberger and Marcel Schlumberger in 1926 and is headquartered in
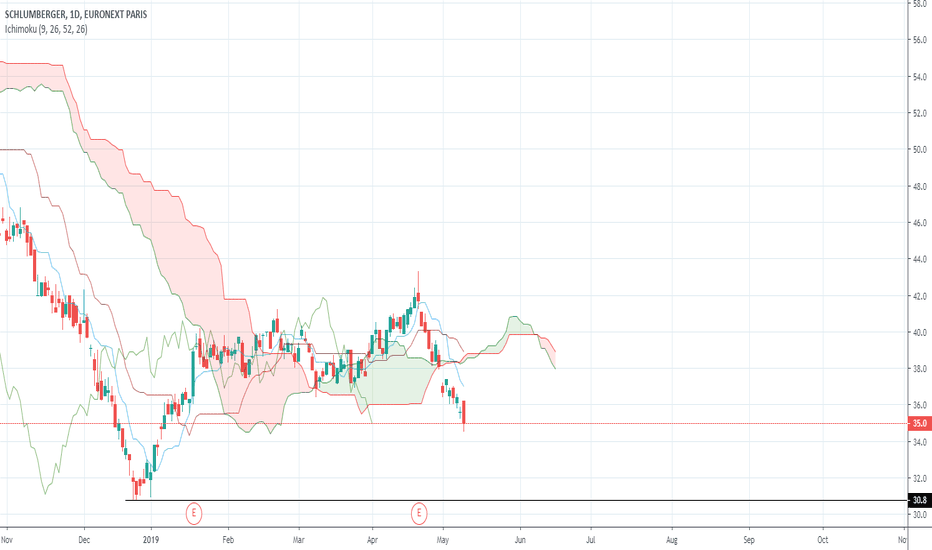
SCHLUMBERGER ; reprise de l'image plus largeAprès un temps de range/hausse, schlumberger reprend la baisse.
Ce qui vient reprendre l'image en weekly/monthly. Assez intéressant dans le contexte global. Les plus faibles courent à la perte.


