SPCE trade ideas

what's next? if the price fail to stay above 31$ there is a chance that we can see 24-25 $ in the following days...


🟢 $SPCE Target 48.15 for 31.22% (Risk Level - MED)🟢 $SPCE Target 48.15 for 31.22% (Risk Level - MED)
Or double position at 29. 01
Open add order @ 30.76 Check chart for additional add levels…
I posted this one yesterday but they I got the dreaded 24 hr TV flag restriction 😬... haha... it's ok...
-----
—
On the far right of the chart is my Average (Grey) Current Target (Green), and Next Level to add (Red) Percentage to target is from my average.
Numbers with an A are places that are a good idea to add if you can.
Numbers with a D are places where you should double your position.
I start every position with .5 - 1% of my account and build from there as needed and as possible.
I am not your financial advisor. Watch my setups first before you jump in… My trade set ups work very well and they are for my personal reference and if you decide to trade them you do so at your own risk. I will gladly answer questions to the best of my knowledge but ultimately the risk is on you. I will update targets as needed.
GL and happy trading.

I was wrong, SPCE got discounted after all! What next?After the successful flight with Branson on board, my prediction was that the price will reach above the all-time high at 62.79 However, the company decided to raise additional capital through issuing new shares AND the first following trading day wasn't exactly good for the stock market overall. Both factors combined lead to cumulative selling.
Even though some profit-taking (and hence drop) was bound to happen after this massive growth, I didn't expect it right after the event.
Today's chart shows three bearish candles which are behaving exactly according to Wyckoff's law of effort vs. result . This means, that there isn't much hideous buying and the drop is genuine and strong.
There are two supports staying in the way of further drop. 200 MA slowed the price every time it was approached. I highlighted all recent instances with a pink circle.
Monthly Highs/Lows are always good to be aware of. Blue circles show recent reactions to monthly Highs and Lows.
200 MA and the previous month's Low are very close and are likely to be tested today or tomorrow. I think it is a good place to buy extra shares, but the price is unlikely to rally to previous levels right now! There are no scheduled events that would trigger interest in the stock and financials are scheduled just 21 days away.
A company announced that it will report its financial results for the second quarter of 2021 following the close of the U.S. markets on Thursday, August 5, 2021. Virgin Galactic will host a conference call to discuss the results that day at 2:00 p.m. Pacific Time (5:00 p.m. Eastern Time). (14th July, official website of VG)
This company has a future and has just demonstrated that it can fulfill its vision. But with no events in sight for both Virgin Galactic and Virgin Orbit, Galactic will be in the shadow of other big players and won't attract many new investors until such events occur.
I might be wrong again.
Good luck!

VIRGIN GALACTIC From our previous analysis on the same, we took a buy at 20 level and traded wave 3. Price is now in a corrective phase to complete wave 4 then we get in and buy wave 5

SPCE bounce incomingMany investors in the SPCE were betrayed by the green of Brandon and company and they were hoping for good future but instead chart has turn on them.
Despite sell off we can see incoming golden pocket and 50 MA , although sellers were not exhausted today we could see bounce to the Friday which would slow down the the downtrend. Overall on the weekly and monthly charts SPCE appears in uptrend. We have crossed the previous head and shoulders neckline. RSI index is at 32 and Slow stochastic is getting over sold which could also signify incoming bounce.
Golden pocket is at 31 and next support is at 29. Psychological level of 30 could see some incoming bulls.


SPCE Virgin Galactic Where Are The Buyers?This is a daily chart of SPCE. As you can see, SPCE is currently within an uptrend which is best defined by a large channel.
The most ideal entry would be around $23-$25 as this would be the bottom of the channel, but that doesn't mean the price will drop that low.
As we've seen in the past, buyers have stepped in at the 30 Week Moving Average which is the green moving average that the price is currently at. The 200 day MA (blue) would also be another good entry as it has supported the price before in the past.
There are a lot of people looking to invest in SPCE, likely a lot more than before now that Virigin has had a successful flight, but panic sellers, shorts, and Virgin diluting shares has brought down the price quite a bit from it's peak and are currently in control of the price action.
A more aggressive investor would want to get in somewhere around $34 (30W MA) while an investor who feels they can take it or leave it with this stock would find the best entry at the bottom of the channel.
From the calculations I've seen (I have not double checked them myself), the dilution should only negatively impact the price about 4-6% which means the majority of the selling is being done by panic sellers and shorts. I would assume SPCE is finished with the dilution of shares and I believe we should see confirmation from them soon stating this as well.
I personally believe SPCE will one day return to the top of this channel but I have no inclination on when that will be. Since the top of the channel is an ascending trend line, the price target increases with time.

SPCE - RIDE IT FOR A SHORT RIDE UP, THEN A LONG RIDE DOWNPerfect Set-up here with low risk, ride it back up to the .5fib fib retracement, and then all the way down to profit targets at 1:1 fib ext, or 1:1.5, 1:1.618 extensions. Potential for big profit here if you can ride the swings right.

Elon Can Suck a Phat One Because Richard Branson Is KingChart is self-explanatory. Elon and SpaceX don't have shit on Virgin Galactic

SPCE PopSPCE has ran down straight into support, usually on the first hit of support there is a quick pop in the opposite direction usually up toward moving average resistance. Looking for this to pop to 43, otherwise cut it if it breaks further down past 35.75 range.

Cup and HandleGoing out on a limb here and this one is NOT to long entry level.
News will make this go up, possibly after a rough day today
No recommendation
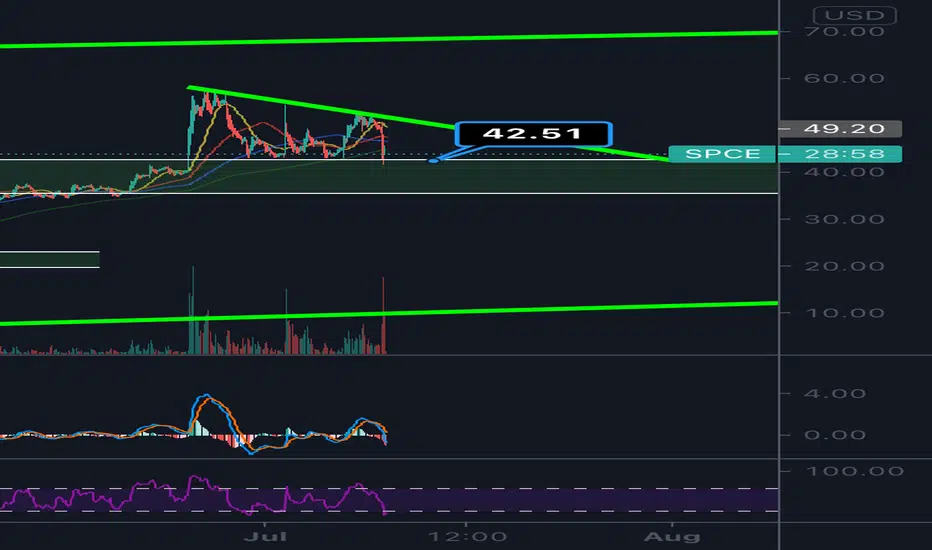
$SPCE possible bounce on watch 38$ Hey guys been away on VK for a while , first day back at it (treading lightly). Watching $SPCE here after a perfect example of a 2-618 Short at 52.60 w daily inside bar (labeled both on chart) Eyes on this butterfly to flip $SPCE long, around 38$, stop & tp's all labeled on chart, Tp 1 my stop is even, i will update trigger level should we get there. I will attach SPCE's Last Butterfly as well in notes below. Thanks for checking it out, feel free to like or comment please.

SPCE: Is it worth to trade it right now?Hello traders and investors! Let’s take a look at SPCE today!
Yes, SPCE is dropping sharply, we have no reversal sign around, and there’s nothing telling us it’ll stop dropping. However, we have some key points to keep in mind.
Since we lost the 21 ema and the gap area (yellow square), which was indeed an Exhaustion Gap , I think we can work with Fibonacci here. Another support lost is the 38.2% retracement, and in these circumstances, the 50% retracement usually works.
This retracement level is around $ 35.80, which is starting to get close to the 21 ema in the weekly chart:
It looks like we had a huge V-Shape recovery here, and now we are just doing a pullback. In the mid-term, the odds are that one of the retracements will hold the price, but the 50% retracement would be a perfect support. If SPCE hits there, then it might be worth to trade it.
If SPCE will lose it afterwards, or if it’ll give us a reversal sign and fly again to the $ 60 we don’t know yet. SPCE could be an interesting stock to trade, but right now, my students and I are aiming for more interesting stocks.
Just focus on the points mentioned in this analysis and you’ll be just fine. If you liked this analysis, remember to follow me to keep in touch with my daily free studies, and support this idea if it helped you!
Thank you very much!

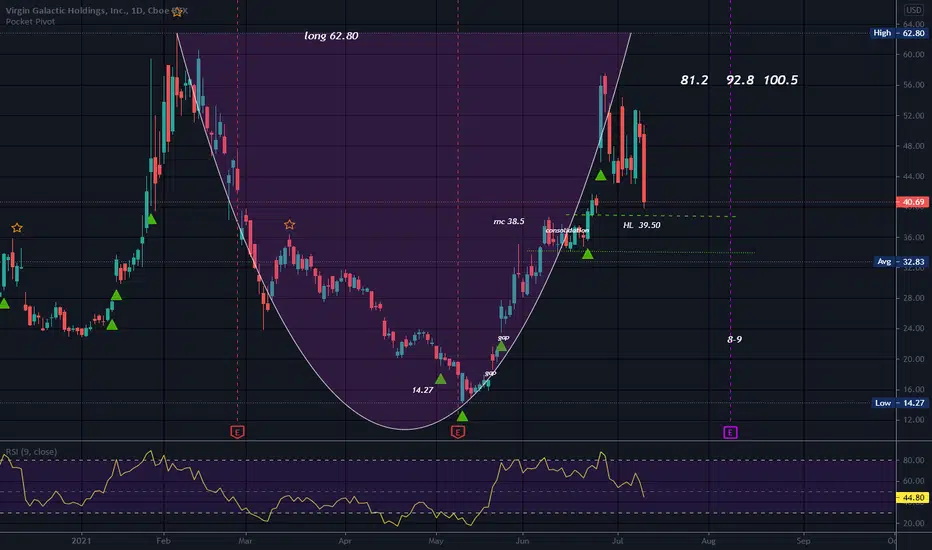
VIRGIN GALACTIC Ignore the rumors focus on the Buy ZoneThe flight of Virgin Galactic is the talk of the town but the recent rejection near the 62.80 Resistance reminds us to just follow the technicals. Since the November 2019 low the stock has been rising on Higher Lows with the 1D MA200 (orange trend-line) and the 1W MA100 (green trend-line) offering a rough Buy Zone along with the RSI. Until 62.80 breaks, the target should be on the Lower Highs trend-line. Above the 62.80 Resistance, the Fibonacci extensions come into play.
** Please support this idea with your likes and comments, it is the best way to keep it relevant and support me. **
--------------------------------------------------------------------------------------------------------
!! Donations via TradingView coins also help me a great deal at posting more free trading content and signals here !!
🎉 👍 Shout-out to TradingShot's 💰 top TradingView Coin donor 💰 this week ==> Ether2020
--------------------------------------------------------------------------------------------------------

SPCE $55 Support By AugustSPCE should be valued at NO LESS than $55 come August. After today's successful flight and the current bull flag it is in. It would come as a surprise if we brokedown from here. Opening above $50 on 7/12/21 would indicate a nice run up for the following week

SPCE bound *update*Currently testing those key supports at the $35-$40 mark we talked about last week, as the pattern starts to complete itself.
Watching for confluence of indicators, which could be the sign of a trend reversal & a strong buy signal.
I love it when a plan comes together.

Waiting for the earnings ...Richard went into space and the action went wrong direction.
Let me know what you think of SPCE.

SPCE fractal Just a theory, but SPCE looks to be repeating the same run up it had a few years ago. With indices still looking strong for the foreseeable future, a rising tide lifts all boats which should consequently see SPCE continue upwards too. Upwards of $120 by end of August if it plays out.

🟢 $NEW POSITION $SPCE Target 51.93 for 28.32% 🟢 $NEW POSITION Target 51.93 for 28.32%
Or double position at 29.01
Check chart for additional ADD levels…
—
On the far right of the chart is my Average (Grey) Current Target (Green), and Next Level to add (Red) Percentage to target is from my average.
I start every position with 1% of my account and build from there as needed and as possible.
I am not your financial advisor. Watch my setups first before you jump in… My trade set ups work very well and they are for my personal reference and if you decide to trade them you do so at your own risk. I will gladly answer questions to the best of my knowledge but ultimately the risk is on you. I will update targets as needed.
GL and happy trading.
I finally added my YouTube Training Video to my profile tagline since I’m not allowed to on here. It’s a quick 15 minute training video on how to set up your chart and how to spot opportunities. So check here first but If you have questions just message me.
If you understand options at all I’m trying to learn so shoot me some pointers…
And if you can understand my charts at all you’re gonna crush it…


SpceAnyone grab that short with me. I move stops right now. I have support around here if this holds we could shoot back up to rejection area around 52 if it breaks I have strong support at 35.80 but breakdown would be 27.80. I do feel this could hold here. A lot said news news news but remeber charts usually show news buying events way before any media gets to it! 16$-55 is a huge move