SPCE trade ideas


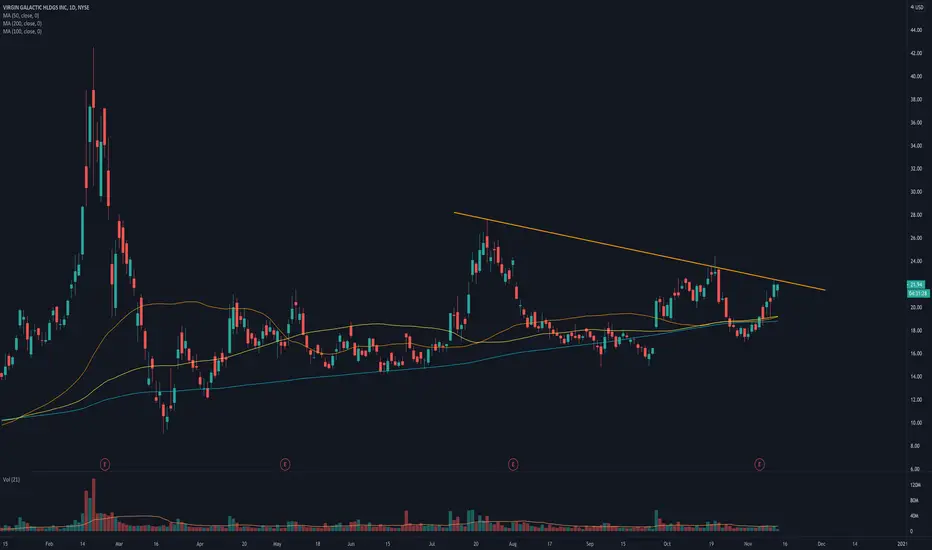
$SPCE potential major upside 1hr cup and handle successfully broke out allowing this to make the run on the daily for major trend line. if that gets broken its time for this to shoot into space! just watch this.

SPCE - keep an eye on this one to continue up monday 11/16/2020INTU closed the day Friday just above Thursday's high. Technically this means we should remain in pursuit of my upper target. Will be keeping an eye on this one tomorrow.
#INTU $INTU

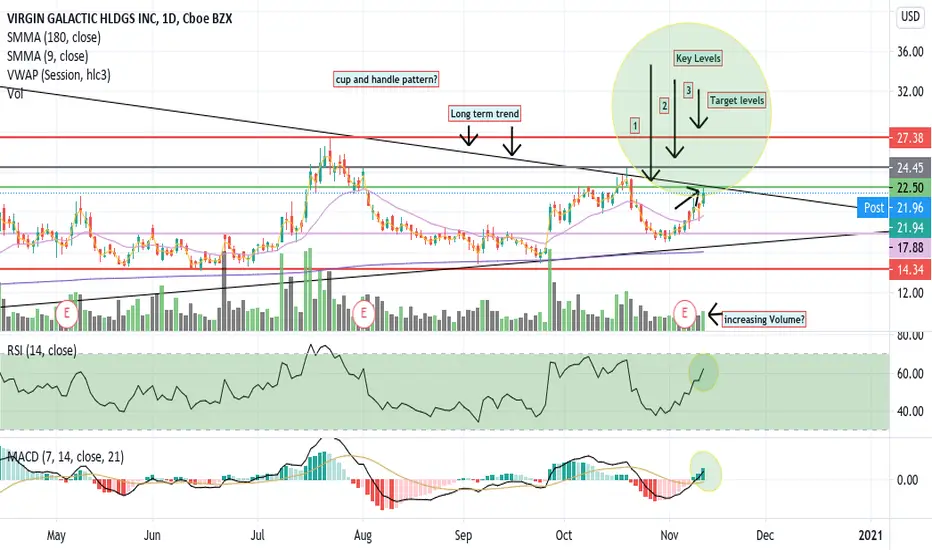
SPCE forming cup & handle : target $25.50 : trade 21/23 strangleIt looks like SPCE is forming a cup & handle pattern. My target is $25.50 by 11/20, but because SPCE can be volatile, I entered a strategic risk : reward trade $21/23strangle11/20 contracts at 3:15pm. Do your own due diligence, your risk is 100% your responsibility. Consider being charitable with some of your profit to help humankind. Good luck and happy trading friends...
*3x lucky 7s of trading 101*
7pt Trading compass:
Price action, entry/exit
Volume average/direction
Trend, patterns, momentum
Newsworthy current events
Revenue & Earnings
Debt / Cash
Book value, assets
7 Common mistakes:
+5% portfolio trades
Bad risk management
Emotions & Opinions
FOMO : bad timing
Lack of planning & discipline
Forgetting restraint
Obdurate repetitive errors
7 Important tools:
Trading View app!, Brokerage UI
Accurate indicators & settings
Wide screen monitor/s
Trading log (pencil & graph paper)
Big organized desk
Reading books
Sorted watch-list
Checkout my indicators:
Fibonacci VIP - volume
Fibonacci MA7 - price
pi RSI - trend momentum
www.tradingview.com

IS $SPCE READY TO LAUNCH?? FULL BREAKDOWNHit the like button and subscribe for more videos! Shoot me a request and ill try and get to it ASAP! $SPCE

ABC BullishVery close to T1
Support noted at 18.25ish
Possible stop below C or under 17
No rising wedges in tthe yearly chart
Short interest is very high so there is a gambit of folks betting this will go down.
But when is the question?
Targets 2 are long term targets and it is often better to focus on T1
Just an observation and I do not own this stock

Breaking new heights Playing off the moving averages and looking great on the macd, not oversold, not overbought. With the flight coming up it has the ceiling to grow. So much potential

SPCE - inside daily candle - 11/12/2020set you alerts at today's high/low. if it breaks with volume , expect it to continue on the my targets on that side of the break.
#SPCE $SPCE


Virgin Galactic heading to 24$Pre flight prices heading higher. After the last needed flight cert on nov 19-23 then to the moon


$SPCE I'm Bullish will ride waves up to $20 and possibly $25$SPCE I'm Bullish will ride waves up to $20 and possibly $25

$SPCE BasingSPCE another triangle wow. Basing and looking for another move higher. This is on news of successful spaceship tests as well as the ever approaching test flights, info about which can be found here:
www.virgingalactic.com

Position initiated - PT $22-25A conservative price target is around the $22-25 price range, still well below the ATH around $33. This is a growth stock and could see many potential catalysts ahead to initiate bullish momentum now that bad news is behind us.


