SPCE trade ideas


Are we finally heading up?This has been going dwn for a while... no volume as of late because no news as of late....
sleepong giant?

Virgin Galactic SPAC.. Shame SHAME!Really?
Who comes up with this Sh..SPAC?
Who buys into this Sh..SPAC?
How do they sleep at night?
If (when) doom spike support level at $9.06 breaks, downside price target =
$0.04 or bust.

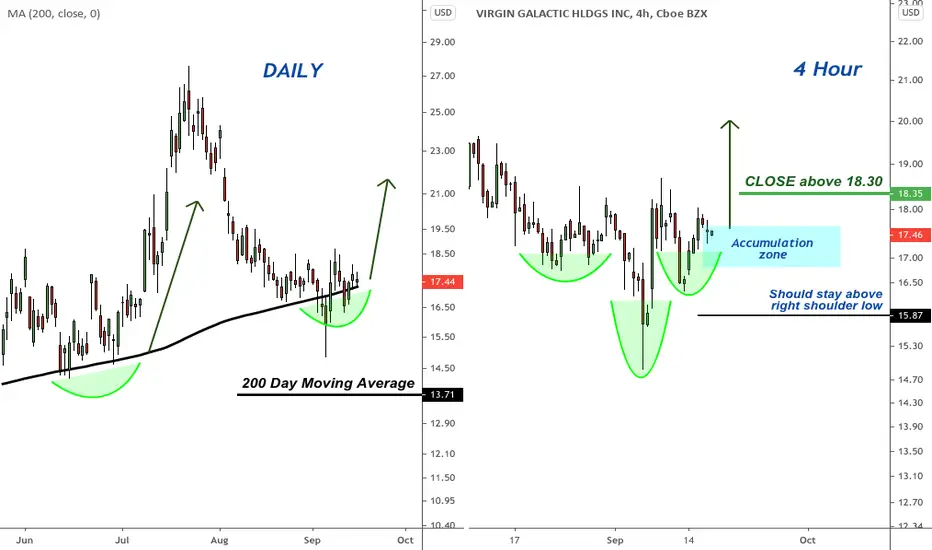
Virgin Galactic (SPCE) is at a key reversal zoneOn the left chart we're looking at the Daily time frame. Notice price is currently resting at the 200 day moving average after reclaiming it earlier this month.
That's positive.
On the right chart we're looking at the 240 min/4hr time frame where price currently displays a possible H&S construction. The stock is at a good accumulation zone here as long as the recent lows hold.
A CLOSE above 18.30 on the 4hr or daily chart can give conservative traders confirmation to get long. Aggressive traders could start buying inside the accumulation zone with stops under the black line I drew (a CLOSE under it would be needed to invalidate the position).
A big question is October 22 for SPCEI personally think that we will go long after october 22. What do you think guys? A huge gain or a huge fail?

VIRGIN GALACTIC aka SPCE is reaching an apex, will it launch?Hey everyone, today we're looking at a longer-term stock that has the potential to get exciting very quickly. I'm really liking how the fundamentals and the technicals are lining up on this wedge I've drawn, what do you think?
Note the end of this Wedge is targeted by November 2020. Meanwhile, there is a strong catalyst that will have this stock either moving higher or lower, and one should be watching this wedge pattern alongside the news:
4 days ago this report came out:
The flight will be the first of two that the space tourism company has planned to complete testing of its SpaceShipTwo spacecraft system and should have just two test pilots on board," CNBC's Michael Sheetz wrote.
"Virgin Galactic said last month that the second test spaceflight will then have four 'mission specialists' inside the cabin," Sheetz added. "If both test flights succeed, Virgin Galactic expects to fly founder Sir Richard Branson in the first quarter of 2021."
If you aren't watching SPCE right now, it's probably a good time to buy and then watch your indicators. I'd hate to miss this, but it's a high risk, high reward trade and so one should set a stop-loss according the the wedge and use the fundamental news as an indicator to match against the future candlestick pattern.
Good luck and happy trading.
Disclaimer: I am not a professional, nor do I claim to know what I am doing. I chart for my own education and revealing potential trade setups. I am always open to constructive feedback and resources that you can recommend to "up" my game. Thank you!

SPCE: Really Slowed down.NYSE:SPCE :
Ownership: I own some far-out options for (+3 15JAN2021 20/40C)
Details: REALLY slowed down on us. News doesn't seem to be moving it much. ATR has fallen all the way to 1.02. I still feel good buying $20 leap Calls, but nothing short term.


SPCE TGT 21.5 , SL 16.5 Good Risk/Reward (Few Indicators)Entry Point: 18.02 or RSI >50
Risk/Reward is 2.3
Candlestick patterns: 4 Sept Hammer, 14 Sept Bullish Harami
Target at 21.5 and Stoploss at 16.5
Background Technical: Upward Edge.
Important breakout at 19.63 (Hold this price)
Good luck!

SPCE - Bullish Triangle Setup3mo chart.
Supported by 2-mo momentum divergence. Looking for a move to $21.


spce short term bearish, then bounce around the $15 and reverseits been sorta boring in this channel, I think it will go down to around the 15 dollar support and bounce up. If theres any news bullish news for spce my wave would be invalid in the short term. Mac d n rsi is just chillin, no momentum.


